


In a previous post, we highlighted that financially fragile households are disproportionately likely to use “buy now, pay later” (BNPL) payment plans. In this post, we shed further light on BNPL’s place in its users’ household finances, with a particular focus on how use varies by a household’s level of financial fragility. Our results reveal substantially different use patterns, as more-fragile households tend to use the service to make frequent, relatively small, purchases that they might have trouble affording otherwise. In contrast, financially stable households tend to not use BNPL as frequently and are more likely to emphasize that BNPL allows them to avoid paying interest on credit-finance purchases. We explore below what drives these differences and consider the implications for future BNPL use.
While the exact terms of BNPL plans can vary, they have been defined by the Office of the Comptroller of the Currency as “loans that are payable in four or fewer installments and carry no finance charges.” They are generally offered to online shoppers at checkout. BNPL plans have grown increasingly prominent in recent years, and today can be used for a wide variety of online purchases, ranging from standard retail orders to fast food deliveries. Still, because of the general lack of regulation surrounding BNPL loans, little is known about how and why households use them. To examine how BNPL use varies with a consumer’s financial situation, we draw on special questions added to the October 2023 Survey of Consumer Expectations (SCE) Credit Access Survey. The survey is fielded every four months as a rotating module of the “core” SCE, which is itself a monthly, nationally representative, internet-based survey of a rotating panel of household heads that has been conducted by the Federal Reserve Bank of New York since June 2013. Our sample consists of about 1,000 households, with about 200 reporting BNPL use.
We differentiate between two types of respondents: 1) the financially fragile, whom we define as having a credit score below 620, having been declined for a credit application in the past year, or having fallen thirty or more days delinquent on a loan in the past year, and 2) all other respondents, whom we refer to as financially stable. Our results reveal different use patterns between the two groups, with the financially fragile being more likely to use BNPL for frequent small purchases. As we discuss below, this finding contrasts with past survey evidence suggesting that BNPL use is mostly experimental, and it provides further evidence that the option is particularly attractive to those who have trouble obtaining credit otherwise. We also show that across levels of financial stability, it is rare for people to use BNPL just once. Indeed, about 72 percent of financially stable users and 89 percent of financially fragile users have made multiple BNPL purchases over the past twelve months. While we cannot determine if this relationship is causal, it is suggestive that a first use often results in repeat use, and it will be a factor to watch as more consumers try BNPL for the first time.
How Often Do Households Use BNPL?
A growing number of surveys, including our own, have shown that BNPL use is particularly likely among financially fragile individuals. Still, relatively little is known about how often households use BNPL. One exception is survey evidence presented by our colleagues at the Federal Reserve Bank of Philadelphia’s Consumer Finance Institute (CFI) suggesting that BNPL use is largely experimental, with most users not using the service as a regular payment option. That said, given that the CFI’s survey was conducted in November 2021 and that the landscape surrounding BNPL is fast changing, it is possible that many first-time users in the CFI survey have continued to use BNPL since.
Conditional on using BNPL at least once, we asked respondents about their use frequency and average purchase sizes. Similar to our findings on which households use BNPL at all, we find that the financially fragile are disproportionately likely to use BNPL at higher frequencies and appear to have embraced BNPL as a regular payment option, as shown in the chart below. Indeed, among financially fragile BNPL users, about 60 percent have used the product five or more times in the past year, which translates to about 18 percent of all survey respondents deemed financially fragile (which includes those who have not used BNPL in the last year). This implies that financially fragile users are almost three times as likely as financially stable users to use BNPL five or more times and suggests that high-frequency use may grow if the product continues to be adopted by financially fragile households. Given that BNPL use in the U.S. has not been observed over a full business cycle, this factor will be particularly important to track, as households may turn to BNPL if their financial conditions worsen.
BNPL Use Frequency by Financial Fragility
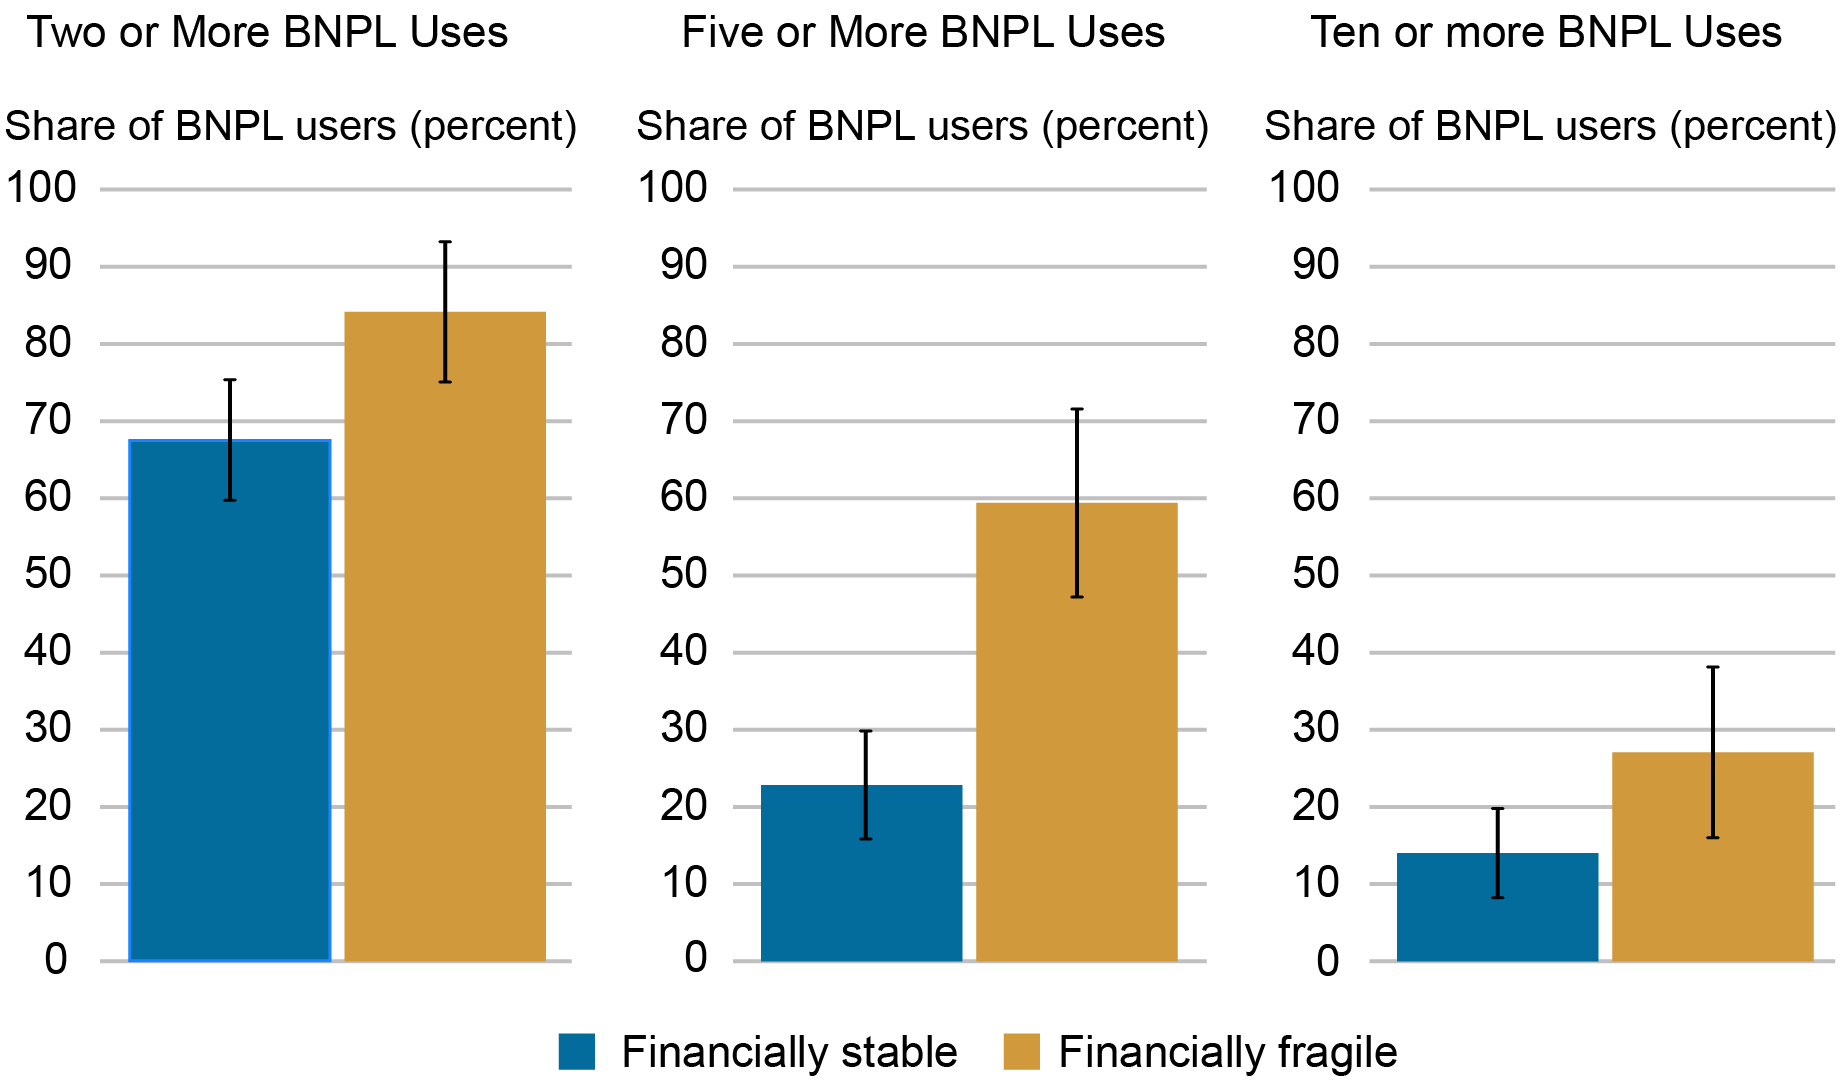
Source: SCE Credit Access Survey.
Our results also indicate interesting aspects of financially stable households’ use patterns. While about 68 percent of financially stable BNPL users have taken advantage of the product at least twice in the past year, just 23 percent and 14 percent have used it five or more times and ten or more times, respectively. This reveals that use by the financially stable tends to drop off substantially after a few instances, but that there is a small group of financially stable individuals who use BNPL frequently.
Purchase Sizes
Another distinguishing factor between the two groups is the size of the purchases they make. While both groups are skewed toward relatively smaller purchases, 62 percent of financially fragile users have a mean purchase price under $250, compared to about 44 percent of the financially stable (see chart below). Looking at the rest of the distribution, this gap is largely made up in the right tail, as financially stable households are significantly more likely to have a mean purchase price between $1,750 and $2,000.
Share of BNPL Purchases by Price
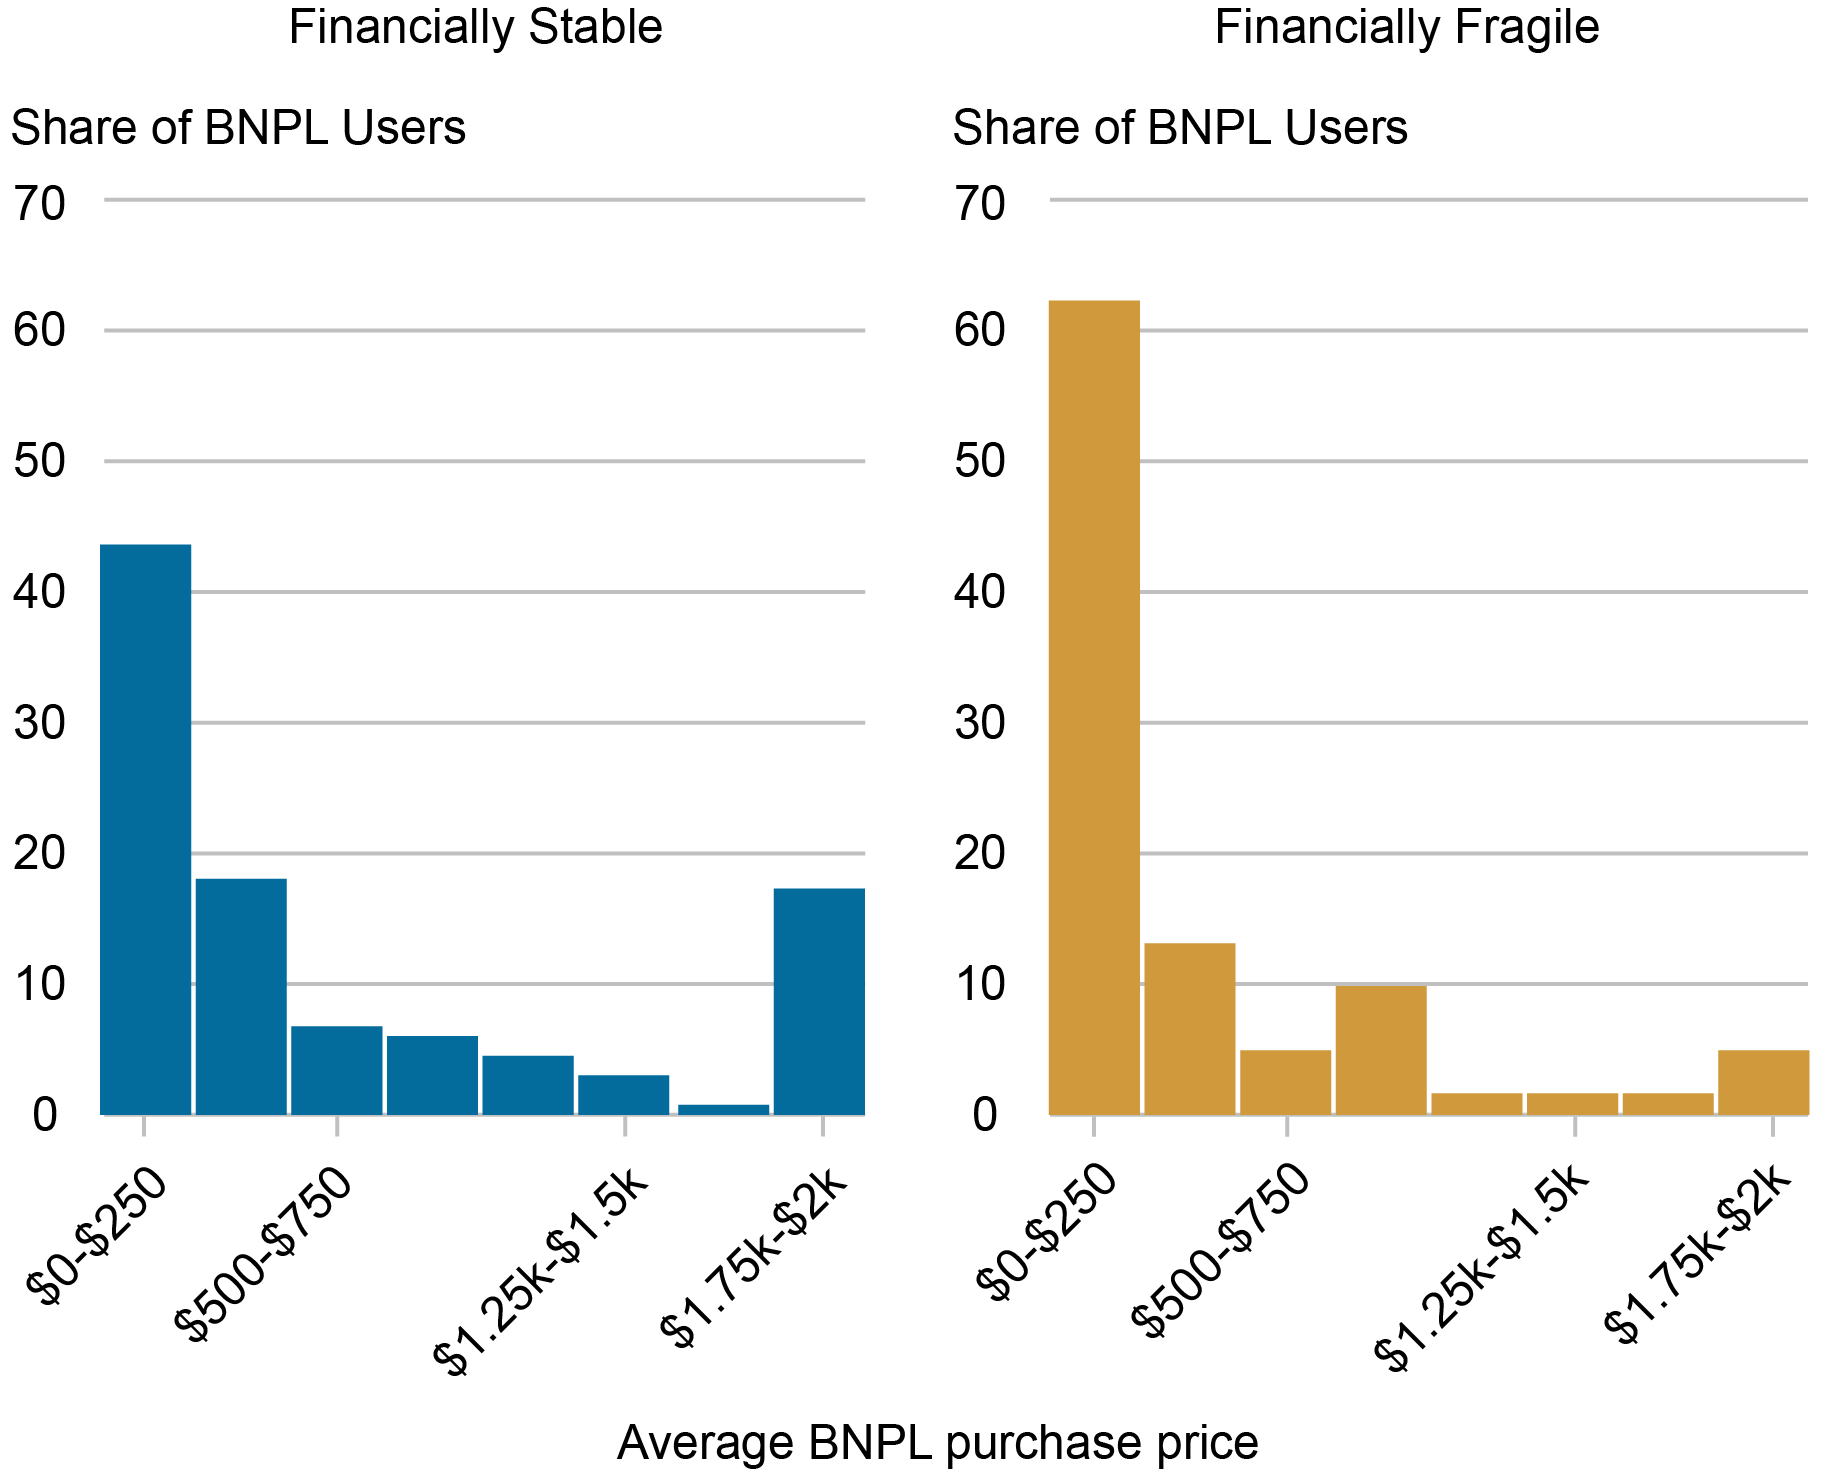
Source: SCE Credit Access Survey.
Importantly, we do not find household income to be a primary driver of these disparities. Even after we control for income, financially fragile households make BNPL purchases that are on average about $220 smaller than financially stable households, and they make more purchases, averaging about four more BNPL purchases than stable household respondents in the past year.
The Anatomy of BNPL Use
To assess what’s driving these differences in use, we asked respondents an open-ended question on why they used BNPL. The word clouds below offer a visual representation of the responses of the two groups, with the size of each word indicating its frequency and prominence in answers overall.
Reasons for BNPL Use Vary by Level of Financial Stability
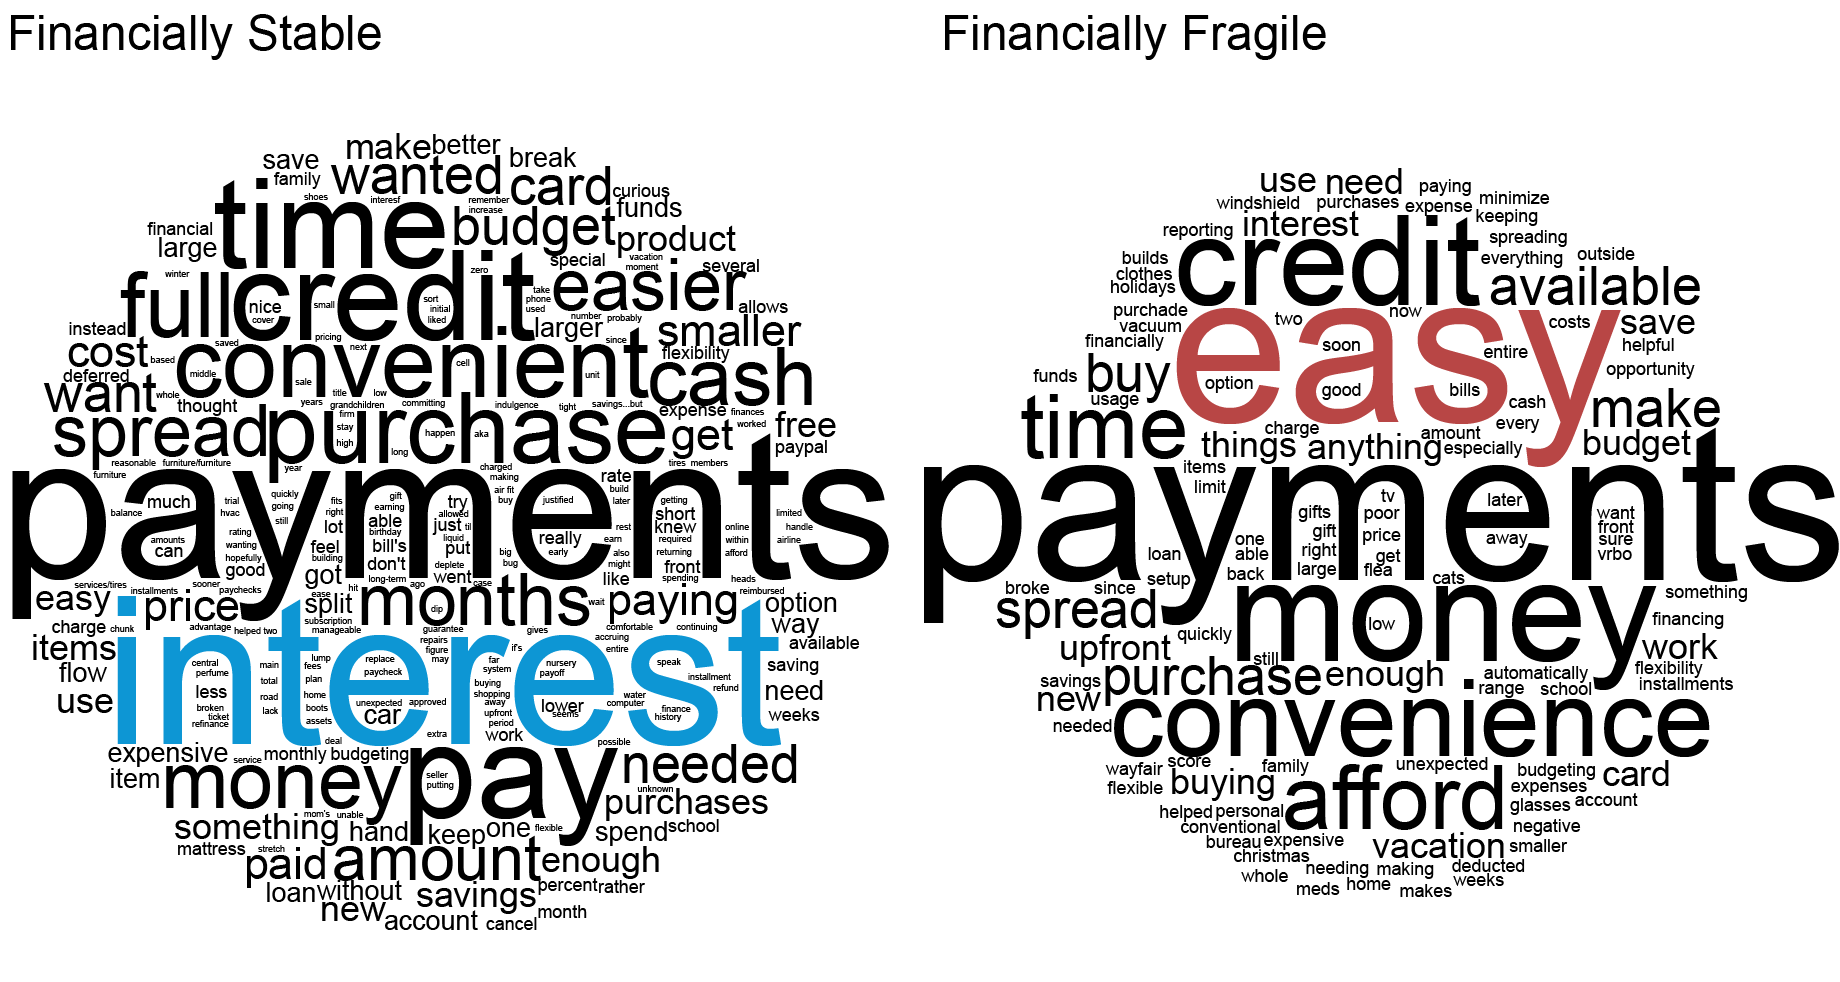
Source: SCE Credit Access Survey.
While both groups emphasize the appeal of spreading out payments, they also display key differences. The financially stable, for example, frequently mention the advantages associated with zero interest, while the financially fragile are more likely to describe ease of access and convenience. Both groups are likely to mention credit, but for different reasons. For example, the financially fragile are generally more likely to mention having poor credit, whereas the financially stable often mention that they’d like to avoid using their credit card or that they see BNPL as a good method of building credit. (Because BNPL lenders generally do not furnish data to credit bureaus, the latter statements may indicate some degree of misunderstanding among the product’s users, unless they are referring to building credit with BNPL lenders specifically.) Lastly, the financially fragile are more likely to state that they are making a purchase that they do not have money for up front or that they could otherwise not afford, while the financially stable tend not to emphasize this point.
Relating our qualitative responses to results on frequency and spending amounts, we can begin to paint a picture of differential BNPL use by financial fragility. For the financially stable, BNPL use appears to be more centered on a few purchases and seems to be largely driven by a desire to avoid paying interest on high-priced items. Meanwhile, use among the financially fragile appears to be more akin to a credit card, as shoppers use the service to make medium-size, out-of-budget purchases frequently. One primary driver of this difference could be access to short-term debt through credit cards. For individuals near their credit limit, BNPL may be particularly attractive as a way to smooth consumption over the short term. Meanwhile, those with ample credit available may choose to use BNPL for medium-size purchases as a way to avoid carrying a balance and accruing interest. That said, our results also reveal some misunderstanding of the product, even among its users, including the financially stable, given that some users seem to assume that BNPL will help them build credit, as mentioned above. Those with this view may be better off using a credit card.
Our results also have implications for future BNPL use. They suggest that the largest barrier to consumer take-up is their first use, and that after this initial use consumers tend use BNPL again. With about 80 percent of households not using BNPL in the past year, there may still be a great deal of room for increased adoption of the product. This will be particularly important to watch in the coming months, as many shoppers used BNPL for the first time this past holiday season.

Felix Aidala is a research analyst in the Federal Reserve Bank of New York’s Research and Statistics Group.

Daniel Mangrum is a research economist in Household and Public Policy Research in the Federal Reserve Bank of New York’s Research and Statistics Group.

Wilbert van der Klaauw is an economic research advisor on Household and Public Policy Research in the Federal Reserve Bank of New York’s Research and Statistics Group.
How to cite this post:
Felix Aidala, Daniel Mangrum, and Wilbert van der Klaauw, “How and Why Do Consumers Use “Buy Now, Pay Later”?,” Federal Reserve Bank of New York Liberty Street Economics, February 14, 2024, https://libertystreeteconomics.newyorkfed.org/2024/02/how-and-why-do-consumers-use-buy-now-pay-later/
BibTeX: View |
Disclaimer
The views expressed in this post are those of the author(s) and do not necessarily reflect the position of the Federal Reserve Bank of New York or the Federal Reserve System. Any errors or omissions are the responsibility of the author(s).
 RSS Feed
 Follow Liberty Street Economics
Very nice study. Thank you for publishing it. I wondered many times, what made this option of financing method rise. Though I never used it, the findings are thought-provoking. It is essentially a great financial tool.