


A commonly used measure of market liquidity is market depth, which refers to the quantity of securities market participants are willing to buy or sell at particular prices. The market depth of U.S. Treasury securities, in particular, is assessed in many analyses of market functioning, including this Liberty Street Economics post on liquidity in 2023, this article on market functioning in March 2020, and this paper on liquidity after the Global Financial Crisis. In this post, we review the many measurement decisions that go into depth calculations and show that inferences about the evolution of Treasury market depth, and hence liquidity, are largely invariant with respect to these decisions.
Where Can One Find Depth?
The quantity of securities market participants are willing to buy and sell at various prices is not fully visible. A common way for a “buy-side” investor, such as a mutual fund, to trade a U.S. Treasury security is for it to contact several dealers (either bilaterally or via a request-for-quote platform) indicating the quantity it is hoping to trade. Each dealer will usually respond with the price at which it is willing to take the other side of the trade and the investor will then typically choose the most attractive price for execution. In this scenario, the prices at which dealers are willing to buy or sell a given quantity of a security are only revealed after the dealers are contacted, and only to that customer and at that instant of time.
Treasury market depth for certain securities can be observed in the interdealer broker (IDB) market, in which dealers and certain other market participants trade among themselves. IDBs operate central limit order books, which collect and consolidate trading interests from platform participants. A snapshot of an IDB’s standing limit orders for a particular time and security is plotted below. It shows that platform participants stood ready to buy $35 million of the on-the-run (most recently auctioned) five-year note at the best bid price and sell $14 million of the note at the best ask (or offer) price. Additional buy (and sell) quantities were available at slightly lower (and higher) prices.
Snapshot of Order Book Depth
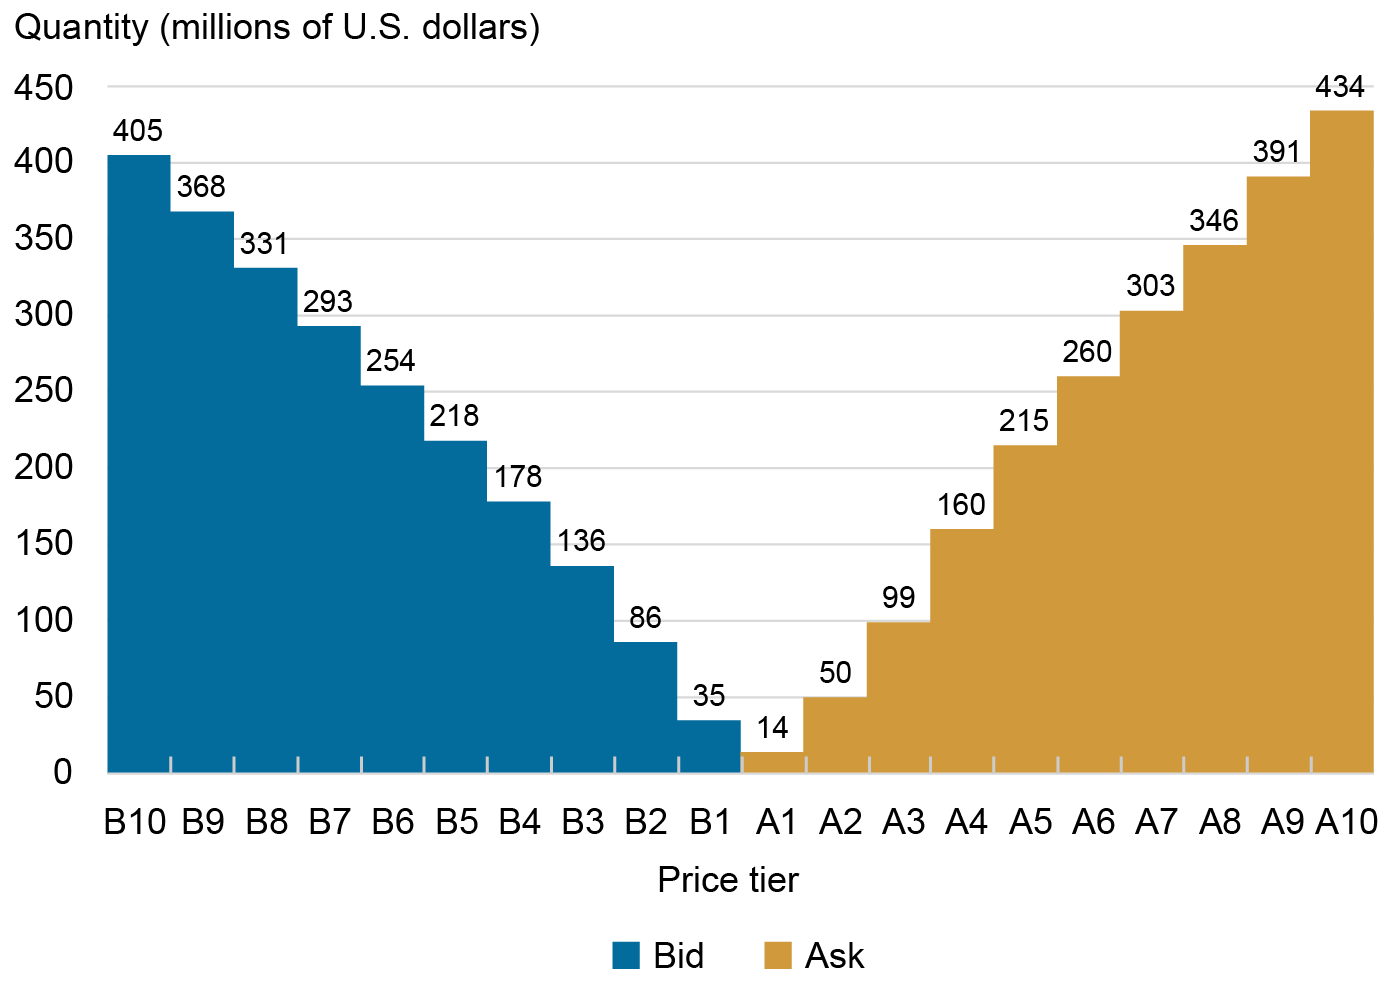
Notes: The chart plots a snapshot of aggregate order-book depth for the on-the-run five-year note on December 15, 2023 at 10:30 a.m. The aggregation means that the $14 million offered at the best ask price (A1) is added to the $36 million offered at the second best ask price (A2) to get the $50 million total offered at the second best ask price or better. The price difference between adjacent price tiers, including the best bid (B1) and the best offer (A1) in this chart, is one tick, which is ¼ of 1/32 of a point for the five-year note (where a point equals 1 percent of par). Depth is measured in millions of U.S. dollars par.
What Does the Depth Data Show?
Order book data show considerable variation in depth over time, as shown in the chart below. Depth plunged amid the COVID-related disruptions of March 2020, recovered thereafter, decreased again in late 2021 and 2022 amidst uncertainty about the expected path of interest rates, and then declined abruptly in March 2023 after the failures of Silicon Valley Bank and Signature Bank. The chart also reveals that the evolution of depth across securities is highly correlated, but that there is some variation depending on security. Since quickly recovering from the March 2023 disruptions, for example, depth has been trending upward for most on-the-run notes and bonds (suggesting improved market liquidity), but relatively stable for the ten-year note.
Order Book Depth Plunged in March 2020 and March 2023
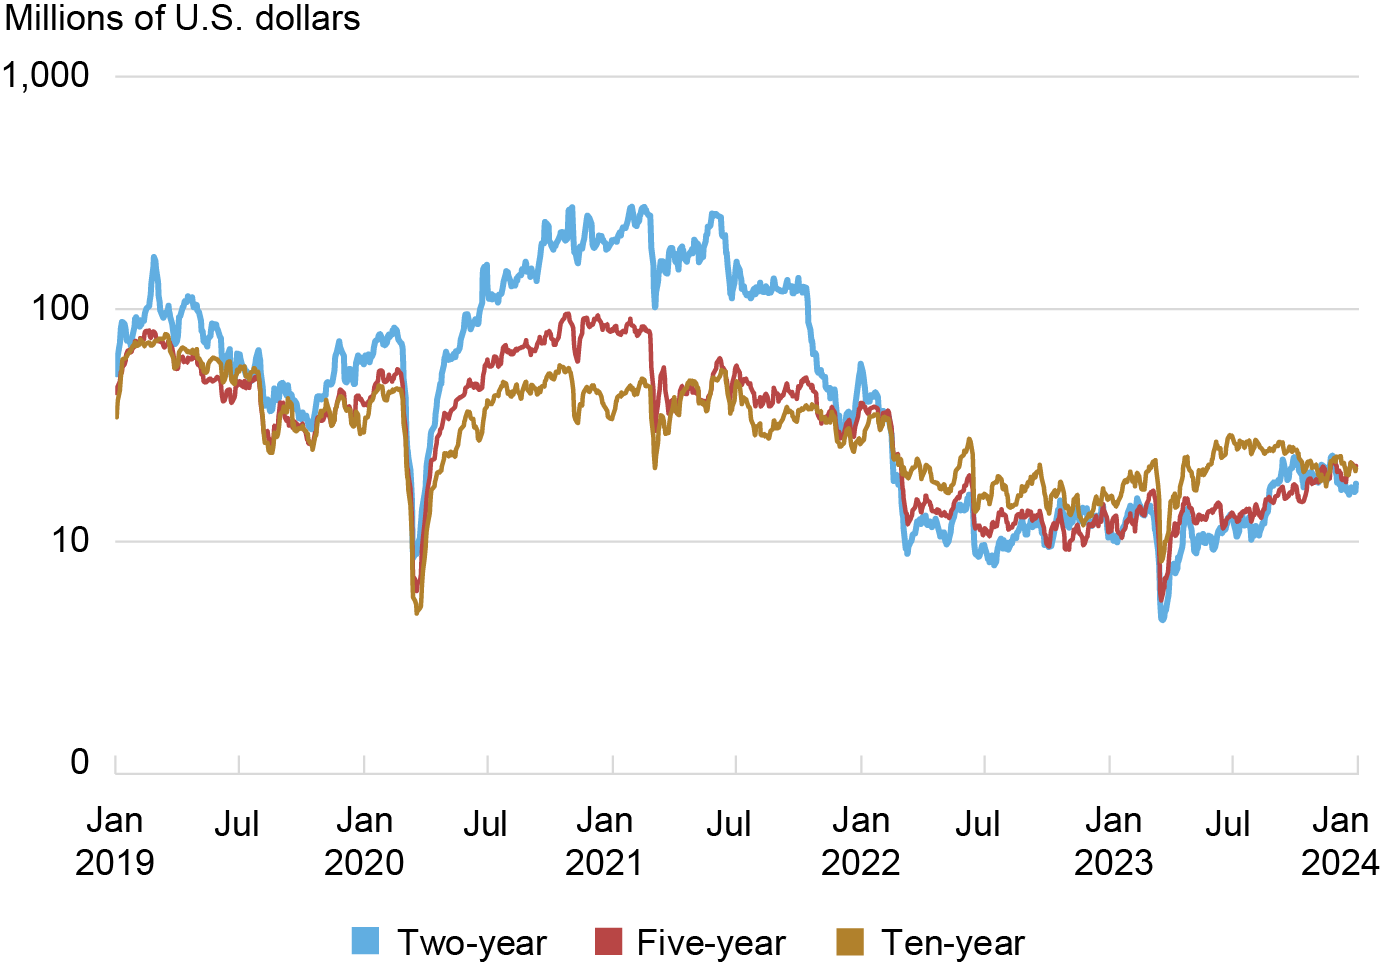
Notes: The chart plots five-day moving averages of average daily depth for the on-the-run two-, five-, and ten-year notes from January 1, 2019 to December 31, 2023. Data are for order book depth at the inside tier, averaged across the bid and offer sides. As an example, depth is calculated as $24.5 million for the order book snapshot plotted above ($24.5 million = [$14 million + $35 million]/2). Depth is measured in millions of U.S. dollars par and plotted on a logarithmic scale.
Decisions, Decisions, Decisions
Many measurement decisions go into the preceding chart. Some are common to the calculations of many liquidity measures, but might have particular salience for depth, whereas others are unique to depth. In the rest of the post, we explore how these decisions affect the level of calculated order book depth and especially inferences about changes in depth and hence market liquidity over time.
Number of Tiers
One key decision concerns the number of price tiers over which depth is aggregated. This Staff Report and the preceding chart plot depth at the best (or inside) bid and offer prices, this report plots depth at the inside three price tiers, and this article plots depth at the inside five price tiers. Of course, depth is greater when aggregation occurs over a higher number of price levels, as shown in the table below (and the first chart above).
Depth Increases with the Number of Price Tiers over Which It Is Aggregated
| Security | |||
| No of Price Tiers | Two-Year | Five-Year | Ten-Year |
| One | 72 | 37 | 33 |
| Three | 278 | 158 | 145 |
| Five | 446 | 256 | 237 |
| Ten | 740 | 446 | 426 |
Notes: The table reports average order book depth aggregated over one, three, five, and ten price tiers for the on-the-run two-, five-, and ten-year notes. Depth is first averaged over each trading day and across the bid and offer sides, and then over the January 1, 2019 to December 31, 2023 sample period. It is measured in millions of U.S. dollars par.
That said, the time series patterns of depth are essentially the same regardless of the number of tiers examined. The table below thus shows correlation coefficients close to one for average daily depth measured across varying numbers of price tiers for the five-year note. A similar pattern is observed for the other on-the-run notes and bonds (as shown in the appendix), although correlations are somewhat higher for longer-term securities and somewhat lower for shorter-term ones.
Depth Evolution Is Largely Invariant to the Number of Price Tiers over Which It Is Aggregated
| One | Three | Five | Ten | |
| One | 1.000 | |||
| Three | 0.977 | 1.000 | ||
| Five | 0.962 | 0.997 | 1.000 | |
| Ten | 0.939 | 0.987 | 0.995 | 1.000 |
Notes: The table reports correlation coefficients among average daily depth aggregated over one, three, five, and ten price tiers for the on-the-run five-year note over the January 1, 2019 to December 31, 2023 sample period. Depth is averaged across the bid and offer sides.
Bid vs. Ask Depth
A second decision concerns whether one should look at bid depth, ask depth, or the average (or sum) of the two. Most analyses look at the average (or sum) of bid and ask depth and don’t say anything about differences between the bid and offer sides (a couple of exceptions are here and here). In practice, average bid and ask depth are quite similar (e.g., $36.4 million and $36.6 million for the five-year note from January 2019 to December 2023), even though the metrics can differ meaningfully at any given point in time (as shown in the first chart). Moreover, the time series patterns of average daily bid and offer depth are almost identical (as shown by the high correlation coefficients reported in the appendix).
Even in March 2020, when massive customer selling overwhelmed dealers’ capacity to intermediate trades (see here and here), average daily depth in the interdealer market was virtually the same on the bid and offer sides, as shown in the next chart. This paper on liquidity and volatility in the U.S. Treasury market also notes that various depth variables (bid and ask, at the first tier and the next four tiers) exhibit similar variation over time.
Bid and Offer Depth Evolved Similarly Around March 2020
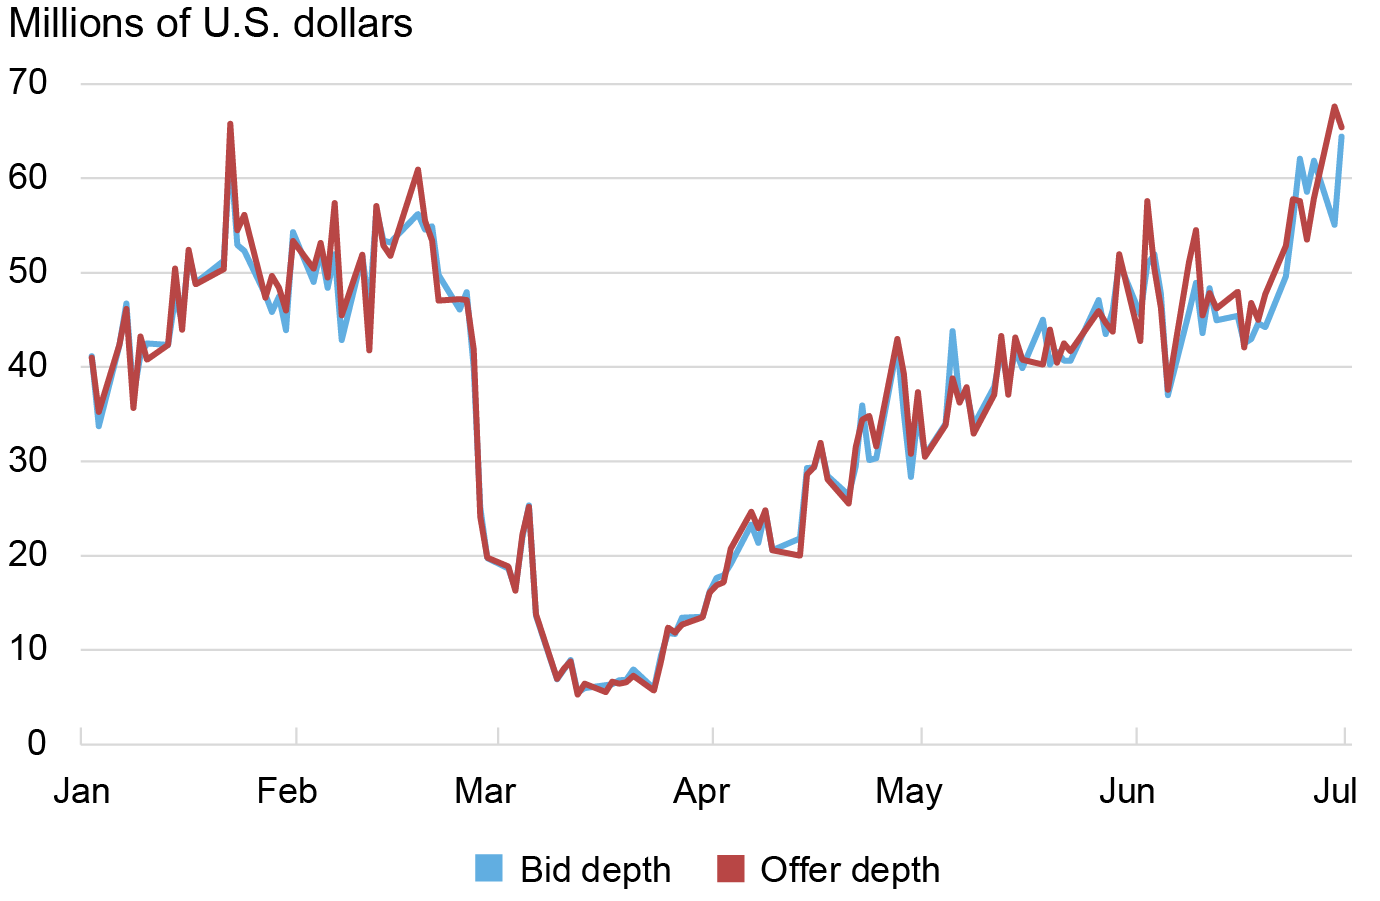
Notes: The chart plots average daily bid and ask depth for the on-the-run five-year note from January 1, 2020 to June 30, 2020. Data are for order book depth at the inside tier. Depth is measured in millions of U.S. dollars par.
To be sure, bid and offer depth may be separately useful inputs for trading decisions or analyses of market disruptions (such as those on October 15, 2014 or February 25, 2021) but for tracking average depth at a daily horizon or longer, there seems to be little information in one metric that is not in the other.
New York vs. Global Trading Hours
A third consideration when summarizing depth is the trading hours over which depth is averaged. Treasuries trade nearly round the clock during the week, as described in this Economic Policy Review article. Liquidity is appreciably better (and trading activity higher) during the more active New York trading hours, roughly 7 a.m. to 5 p.m., as shown in the next chart. It follows that average daily depth is higher if the calculations are done over New York trading hours only (as they are in this post). That said, the time series patterns of average daily depth are virtually indistinguishable whether depth is calculated over New York trading hours or the full global trading day.
Depth Is Higher during New York Trading Hours
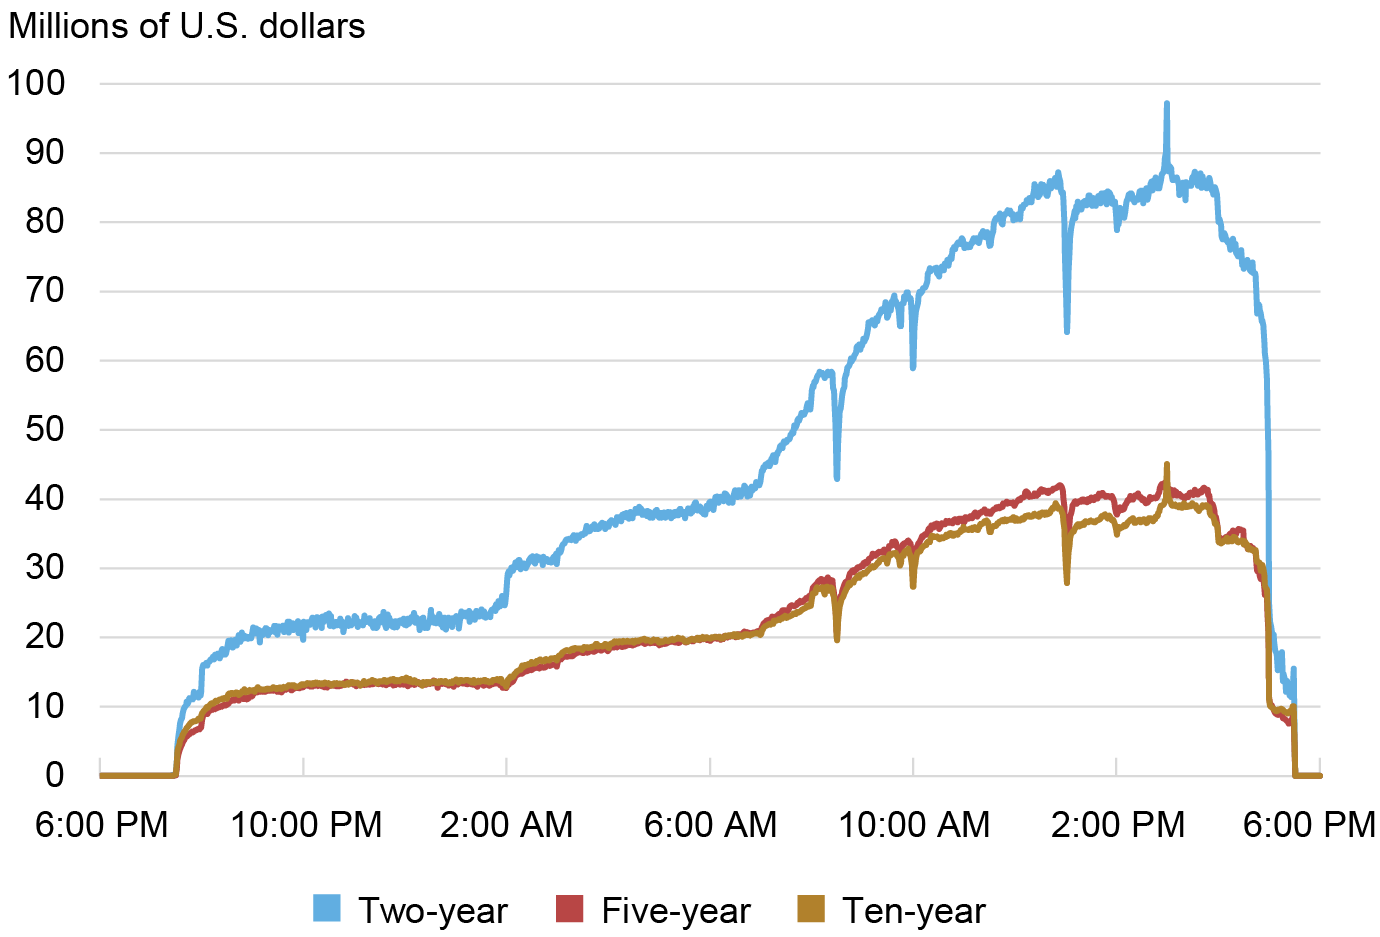
Notes: The chart plots average depth by minute over the global trading day for the on-the-run two-, five-, and ten-year notes. Data are for order book depth at the inside tier, averaged across the bid and offer sides, then averaged for each minute across the trading days from January 1, 2019 to December 31, 2023 when both the U.K. and the U.S. were on daylight saving time (so that time differences between Japan, the U.K., and the U.S. are constant for this analysis). Depth is measured in millions of U.S. dollars par.
Time vs. Tick-Weighting
One other decision concerns the weighting scheme for calculating average depth. “Time-weighted” means that depth for each time interval gets equal weight. “Volume-weighted” means that depth for each time interval is weighted by volume in that interval, and “tick-weighted” (used in this post) means that depth at each change in the limit order book (which can be defined various ways) gets the same weight. Given that trading activity varies so much over the global trading day, average depth necessarily varies depending on the method of calculation. Again, however, the evolution of average daily depth is almost identical whether calculations are time-weighted or tick-weighted.
Summing Up
Many decisions go into the calculation of market depth from order book data. Although these decisions have meaningful effects on the average level of computed depth, they have little effect on inferences about Treasury market liquidity made from changes in daily depth over time. Whether it’s bid vs. offer side, inside tier vs. many tiers, or New York hours vs. all hours, market depth has been challenged in recent years by the pandemic, bank failures, and interest rate uncertainty generally, and bears watching (along with other liquidity measures) going forward.

Michael J. Fleming is the head of Capital Markets Studies in the Federal Reserve Bank of New York’s Research and Statistics Group.

Isabel Krogh is a research analyst in the Federal Reserve Bank of New York’s Research and Statistics Group.
Claire Nelson is an economics Ph.D. candidate at Princeton University.
How to cite this post:
Michael Fleming, Isabel Krogh, and Claire Nelson, “Measuring Treasury Market Depth,” Federal Reserve Bank of New York Liberty Street Economics, February 12, 2024, https://libertystreeteconomics.newyorkfed.org/2024/02/measuring-treasury-market-depth/
BibTeX: View |


Disclaimer
The views expressed in this post are those of the author(s) and do not necessarily reflect the position of the Federal Reserve Bank of New York or the Federal Reserve System. Any errors or omissions are the responsibility of the author(s).
 RSS Feed
 Follow Liberty Street Economics
Very interesting article. Hopefully market depth can get back on track, now that the pandemic is over and interest rates are becoming more stable.