


Since the start of the year, oil prices have risen sharply owing to worsening expectations regarding global oil supply. We’ve also had an acceleration of inflation in the United States and the euro area, as well as a sharp steepening of the expected paths of policy rates in both economies. These factors, combined with the potential for a slowdown in growth, have made the inflation outlook quite uncertain. In this post, we combine the demand and supply oil price decomposition from the New York Fed’s Oil Price Dynamics Report with yield curve data to quantify the likely path of inflation in the United States and the euro area over the next twelve months. Based on our analysis, we anticipate that inflation will likely remain elevated through the second quarter of 2023, despite payback for the inflationary impact of current negative oil supply shocks during the second half of 2022 and the disinflationary effects of tighter monetary policy.
Recent Oil Price Developments
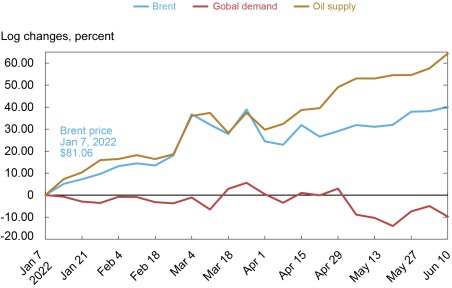
The statistical model underlying the New York Fed’s Oil Price Dynamics Report examines correlations between weekly oil price changes and a broad array of financial and oil production-related variables by means of a limited number of common factors. These are then interpreted as related to anticipated developments affecting supply and demand in the global oil market. In the chart below, we plot the cumulative change of the Brent crude oil price since the start of 2022 up to June 10, which is the end of estimation samples used in our forecast models later. The chart also depicts the corresponding expected demand and anticipated supply components of Brent crude price changes from the oil price decomposition model. This year’s oil price increases have mostly resulted from a sharp deterioration of anticipated global oil supply. Upward price pressure from adverse oil supply shocks, especially after the Ukraine Invasion during the week ending February 25, have pushed Brent crude up by about 63 percent year to date. Deteriorating global demand expectations have partially checked the upward price pressure stemming from anticipated strain on supply, especially over the most recent weeks.
Anticipated Oil Supply Pressures Have Contributed the Most to Rising Oil Prices in Recent Months
Central Bank Policy Rate Expectations
Financial market pricing throughout this year has been driven in large part by shifting expectations about major central banks’ policy rate paths. To get quantitative measures of these shifting expectations, we can use information from government bond yield curves in the United States and the euro area. Engstrom and Sharpe (2018) show that in the United States, a certain near-term forward spread moves in line with survey-based measures of the expected fed funds rate path over the next five quarters. Their near-term forward spread is defined as the eighteen-month-ahead forward rate of the three-month Treasury bill rate minus the current three-month Treasury bill rate, thus measuring the expected change in the short-term interest rate over the next year and a half. The chart below depicts these near-term forward spreads for the United States and the euro area since the start of the year, constructed using zero-coupon yield curve estimates for the United States , from the Federal Reserve’s Board of Governors, and Germany, from the Bundesbank. This chart clearly shows that the two central banks’ predicted policy paths have steepened sharply, especially since March. It also shows that U.S. monetary policy is expected to be tighter than in the euro area over the next eighteen months.
Monetary Policy Expectations Have Increased This Year across Major Economies
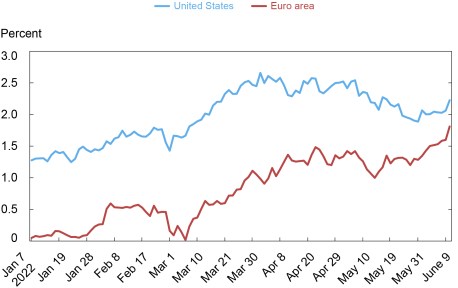
Notes: Monetary policy expectation spreads are calculated by taking the difference between the 18 month forward 3 month interest rate and the 3 month interest rate for each economy. The euro area monetary policy expectation spread is derived from the German monetary policy expectation spread.
Inflation Forecast Distributions
We now want to leverage the information contained in the oil price decomposition, short-term interest rates, and near-term forward spreads to assess the likely path of inflation over the next twelve months. Both oil prices and policy path expectations can behave in a non-linear fashion, where periods of volatile changes are followed by low volatile change periods and vice versa. This might suggest that these variables are of varying importance for different parts of the inflation distribution—for example, tails versus the center. To allow for this, we use quantile regressions that can relate different slices of the inflation distribution separately to changes in oil price components, short-term interest rates, and policy rate expectations.
We use two sets of quantile regressions to be able to forecast inflation over the next year: the first one models the change in the first six months of the forecast horizon, and the second set models the inflation change over the subsequent six months. For the first six-month horizon, the inflation change quantile regressions use the six-month change in the short-term interest rate (representing policy rate changes over the past six months) as well as the demand and supply components of the current six-month change in Brent crude (with all three corrected for realized inflation over the past six months) plus lags of month-over-month changes in annual CPI inflation. Policy rate expectations are thus assumed to not matter over this first six-month horizon: expected policy rate path shifts will first affect financial conditions, which then start impacting real activity after some period and given price rigidities, then finally influence inflation with an additional lag. These policy rate path changes, however, could have an inflation impact for the second, subsequent six-month horizon. Hence, estimation of the inflation change quantile regressions for this second six-month horizon is therefore not only based on the two components of current six-month changes in oil prices, six-month changes in the short-term interest rates, and lagged monthly changes in annual inflation, but also on the current eighteen-month forward interest rate spread.
Once we estimate the inflation change quantile regressions for the tail and central parts of the distribution for the first and subsequent six-month horizons, we generate forecasts for the two horizons and add these up across the corresponding slices of the inflation distribution to get one-year-ahead forecasts mapped into twelve-month inflation levels. We then combine the forecasts across the different slices in a similar manner as in Adrian et al. (2019), and construct forecasted conditional twelve-month-ahead forecast distributions of CPI inflation.
In the chart below, we depict the conditional distribution of U.S. CPI inflation over the next twelve months on two dates: January 14 (incorporating the release of the December 2021 CPI, published on January 12) and June 10 (incorporating that week’s May 2022 CPI release). In January, the likeliest forecast for year-end 2022 U.S. inflation was around 5.8 percent year-over-year, but by May the likeliest forecast for mid-Q2 2023 U.S. inflation wound up around 6.5 percent. Clearly, the increase in U.S. CPI inflation since January, along with the string of adverse oil supply shocks over the period, did push up the likely path of U.S. inflation. Interestingly, the more recent inflation forecast distribution seems more skewed to the downside, suggesting that while the average inflation rates implied by the two distributions have shifted up, the May 2023 distribution suggests more downside risk than the one for December 2022.
One Year Out-of-Sample Forecast Density Indicates a Slowing in U.S. Inflation
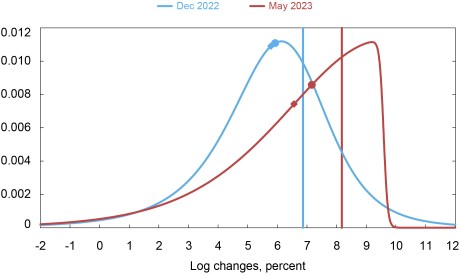
Notes: Circle markers indicate median of forecast density; diamond markers indicate mean of forecast density; vertical lines indicate realized inflation for December 2021 on January 12, 2022 (left) and for May 2022 on June 10, 2022 (right).
We conduct a similar exercise for the euro area with corresponding distributions shown in the next chart below. Compared to the United States, there is a much more dramatic shift in the distributions between the two dates, with the projected year-over-year euro area inflation rates shifting out significantly, rising from about 4.3 percent annually in December 2022 to more than 7 percent in May 2023. The May 2023 euro area inflation distribution also appears relatively more symmetrical than that of U.S. inflation: the probability of inflation being 5 percent or less from the euro area distribution is about 5 percent, whereas this probability is about 22 percent for the U.S. distribution.
One Year Out-of-Sample Forecast for the Euro Area Has Increased in Recent Months
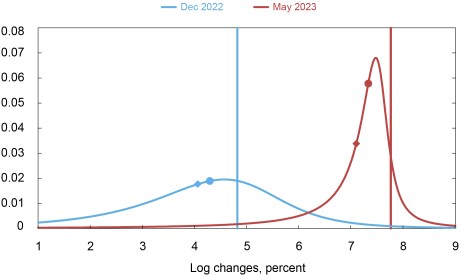
Notes: Circle markers indicate median of forecast density; diamond markers indicate mean of forecast density; vertical lines indicate realized inflation for December 2021 on January 1, 2022 (left) and for May 2022 on June 1, 2022 (right).
Counterfactual Inflation Forecast Distributions
What factors are the largest drivers of these near-term inflation outlooks—policy rate changes or the demand/supply components of oil price changes? To get insight into this question, we estimate a weekly model for the six-month short-term interest changes, the near-term forward spread and both demand and supply components of six-month oil price changes, where each of these four variables depends on lags of all series. Unexpected changes, or shocks, for each of the series are determined by using the residuals of this model. We then apply an ordering such that short-term interest rate changes and the near-term forward spread can affect oil price change components in the same week, but those interest rate series respond to the oil price series the following week. This ordering acknowledges the fact that the oil price decomposition used here relies heavily on the use of a wide range of financial market data. Based on this estimated structure, we can decompose the historical time series for each of the variables into independent parts related to current and past shocks to either policy rates, the expected global demand component of oil price changes, or anticipated oil supply. This, in combination with the estimated quantile regressions, allows us to construct counterfactual inflation forecast distributions that assume that the impact of one or more of these four shocks on the predictor variables are set to zero. Given that tighter monetary policy and oil supply shocks have been the dominant themes recently, we will look at counterfactual distributions where the predictor variables in the quantile regressions are entirely driven by one of these two channels.
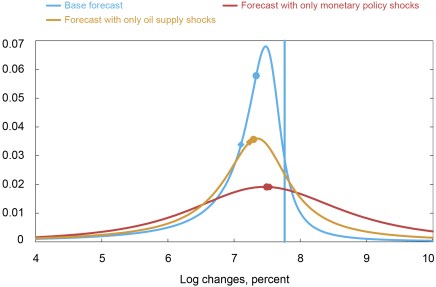
The chart below presents the result of the counterfactual exercises for U.S. CPI inflation. The blue line represents our forecasted May 2023 inflation distribution, which we discussed earlier. The gold and red lines represent counterfactual distributions where we allow only, respectively, anticipated oil supply shocks and policy rate shocks to have impact on the explanatory variables in our quantile regressions. Tighter monetary policy alone is not enough to explain the projected deceleration of U.S. inflation over the year. In the quantile regressions for the second six-month part of the forecast horizon, adverse oil supply shocks have a negative inflationary impact. Hence, apart from more restrictive financial conditions owing to tighter monetary policy, there is an important role for disinflationary payback in the latter part of 2022 for the current inflationary consequences of recent adverse oil supply shocks, driving the downside risk to the forecast.
One Year U.S. Inflation Outlook Is Driven by More Restrictive Financial Conditions and Recent Oil Shocks

Notes: Circle markers indicate median of forecast density; diamond markers indicate mean of forecast density; the vertical line indicates realized inflation for May 2022 on June 10, 2022.
A similar analysis for euro area inflation can be found in the chart below. As with the U.S., we notice here that when we only allow for the impact of adverse oil supply shocks within our predictive quantile regressions, a fair degree of the predicted slowing in euro area inflation comes from the reversal of current inflationary pressures owing to these shocks. Tighter monetary policy impacts the twelve-month euro area forecast distribution somewhat less than that of the United States , especially with regards to the left tail of the inflation forecast distributions. For the euro area monetary policy shocks only distribution, the probability for inflation to hit 5 percent or less is about 7 percent, and for its U.S. counterpart it is about 13 percent.
One Year Inflation Outlook for the Euro Area Is Affected Most by Recent Oil Shocks
Notes: Circle markers indicate median of forecast density; diamond markers indicate mean of forecast density; the vertical line indicates realized inflation for May 2022 on June 1, 2022.
Conclusion
Recent oil price hikes and tighter financial conditions have dominated the news. We use approximations of the drivers behind these developments to quantify the twelve-month outlook for CPI inflation in the U.S. and the euro area. In both regions, inflation is projected to ease somewhat but will remain elevated by May 2023. The forecast distributions do indicate, however, a higher likelihood of a larger-than-expected easing of inflation in the United States compared to the euro area. The projected inflation easing in the United States is mainly driven by a reversal of the inflationary impact of recent oil supply shocks and monetary policy tightening, while in the euro area tighter monetary policy has a less prominent impact.

Jan Groen is an economic research advisor in the Federal Reserve Bank of New York’s Research and Statistics Group.

Adam Noble is a senior research analyst in the Bank’s Research and Statistics Group.
How to cite this post:
Jan J. J. Groen and Adam I. Noble, “How Could Oil Price and Policy Rate Hikes Affect the Near‑Term Inflation Outlook?,” Federal Reserve Bank of New York Liberty Street Economics, June 24, 2022, https://libertystreeteconomics.newyorkfed.org/2022/06/how-could-oil-price-and-policy-rate-hikes-affect-the-near-term-inflation-outlook/
BibTeX: View |
Disclaimer
The views expressed in this post are those of the author(s) and do not necessarily reflect the position of the Federal Reserve Bank of New York or the Federal Reserve System. Any errors or omissions are the responsibility of the author(s).
 RSS Feed
 Follow Liberty Street Economics
In response to Marcelo Lima:
The answer depends on the driver behind the decline in oil prices. In the forecast model we make a distinction between demand- and supply-driven oil price changes, based on the decomposition from the New York Fed’s Oil Price Dynamics Report. We also allow for a potentially differing response to each of these drivers of oil price changes for the first half of the forecast horizon vs the second half of the forecast horizon. For demand-driven oil price changes, there is always a positive impact on inflation, whereas for supply-driven oil price changes there is a positive impact on inflation in the first half of the forecast horizon but a negative impact in the second half of the forecast horizon. So if you expect that oil prices will decline owing to lower demand then our framework would predict lower inflation. But if you expect oil prices to fall because there is higher expected supply, then our model would predict inflation to fall initially but then to rise later on. Obviously, all of this is conditional on keeping all the other elements in our model (short-term interest rates, near-term forward spread, lagged inflation changes) constant.
Judging from the latest update of the Oil Price Dynamics Report,(https://www.newyorkfed.org/research/policy/oil_price_dynamics_report) the recent declines in oil prices were driven both by improving supply and deteriorating demand. It is therefore hard to tell at this stage whether this on net would entail a downgrade or an upgrade in the inflation projection from our model.
Your forecast period through June 10th top-ticked the price of oil in the short term. Can you tell us what happens to inflation if the price of oil keeps going down as indicated by the futures curve?