


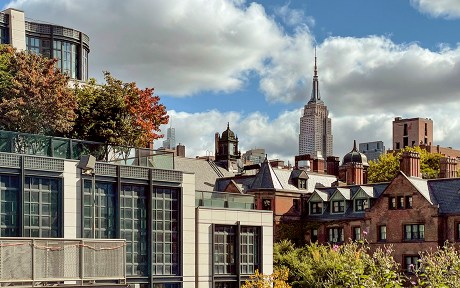
When COVID-19 first struck the U.S. in early 2020, New York City was the epicenter of the pandemic. By early April, there was an unthinkable scale of suffering, with massive hospitalizations and roughly 800 fatalities per day, accounting for nearly half of the nationwide total. The rapid spread was facilitated by the city’s extraordinarily high population density and widespread use of mass transit. What followed was a quick and massive shutdown of restaurants, retail stores, personal services, offices, and more. And the shutdowns, of course, led to widespread job losses. Between February and May, one out of five jobs in the city vanished; in the restaurant industry, 70 percent of jobs were lost. Although the pandemic didn’t go away, the city’s economy has recovered steadily, aside from a brief but sharp setback in late 2020. By early 2023, New York had finally reversed just about all of the total job loss. In this post, we look at the contours of the city’s recovery as a possible guide to where we go from here.
New York City’s Trajectory Going into the Pandemic
In early 2020, the city’s economy was strong, following a more than two-decade boom interrupted only by the 2008-09 recession. In the decade leading up to the pandemic (2010-20), population grew by 7.7 percent citywide—its second-fastest pace since the 1920s—and Manhattan’s population grew at its fastest pace in well over a century. During those same ten years, employment in the city increased by 25 percent—the strongest decade since records began in 1950, and significantly exceeding the nationwide pace, also for the first time on record. Industry-wise, it was a decade in which the city’s tech sector developed a critical mass and came to employ as many people as the city’s historically key securities industry (“Wall Street”).
Real estate markets were mixed but also generally strong. Home prices had tapered off a bit in Manhattan, and the market for retail space was sluggish; however, residential rental markets and office markets were fairly solid throughout the city, and there was a good deal of construction underway. In essence, the decade saw a broad urban renaissance across the nation, and New York City was the exemplar of that trend.
New York City’s Trajectory during the Pandemic
When the pandemic struck New York City in March 2020, the urbanization trend was effectively turned on its head. Many of the city’s unique attributes that had been seen as assets—agglomeration, dense population, vibrant offices and workplaces, extensive mass transit, crowded bars and restaurants—suddenly became liabilities, and fun gatherings became potential “super-spreader events.” By the end of March, hospitals were overwhelmed, indoor dining was prohibited, gyms, museums, and other public spaces were closed down, numerous events were canceled, and air travel all but ground to a halt. Those who could work from home were asked to do so, and many of those considered essential on-site workers had to brave the subways and buses. Employment fell 20 percent from February to April, and the systems used to process applications for unemployment benefits were swamped.
The approach of summer 2020, however, brought some respite, as the pandemic receded, and many businesses adapted to the new reality. Restaurants focused on takeout and delivery, retailers went online, and at least one major wholesale restaurant distributor began selling direct-to-consumers. Employment began to recover, notably in the leisure and hospitality sector (largely restaurants), where the job count had initially fallen by 70 percent. Even so, by August 2020, employment in that hard-hit sector was still down more than 50 percent from pre-pandemic levels, and—as a sign of how depressed the local economy still was—subway ridership was still down about 75 percent.
Fast-forward to the beginning of 2023. As shown in the chart below, almost all of New York City’s job loss has been recovered, with its job count just 1 percent below its pre-pandemic peak. While the city still lags the nation, which has already seen employment recover fully and reach new highs, it is catching up.
New York City’s Employment Almost Fully Recovered
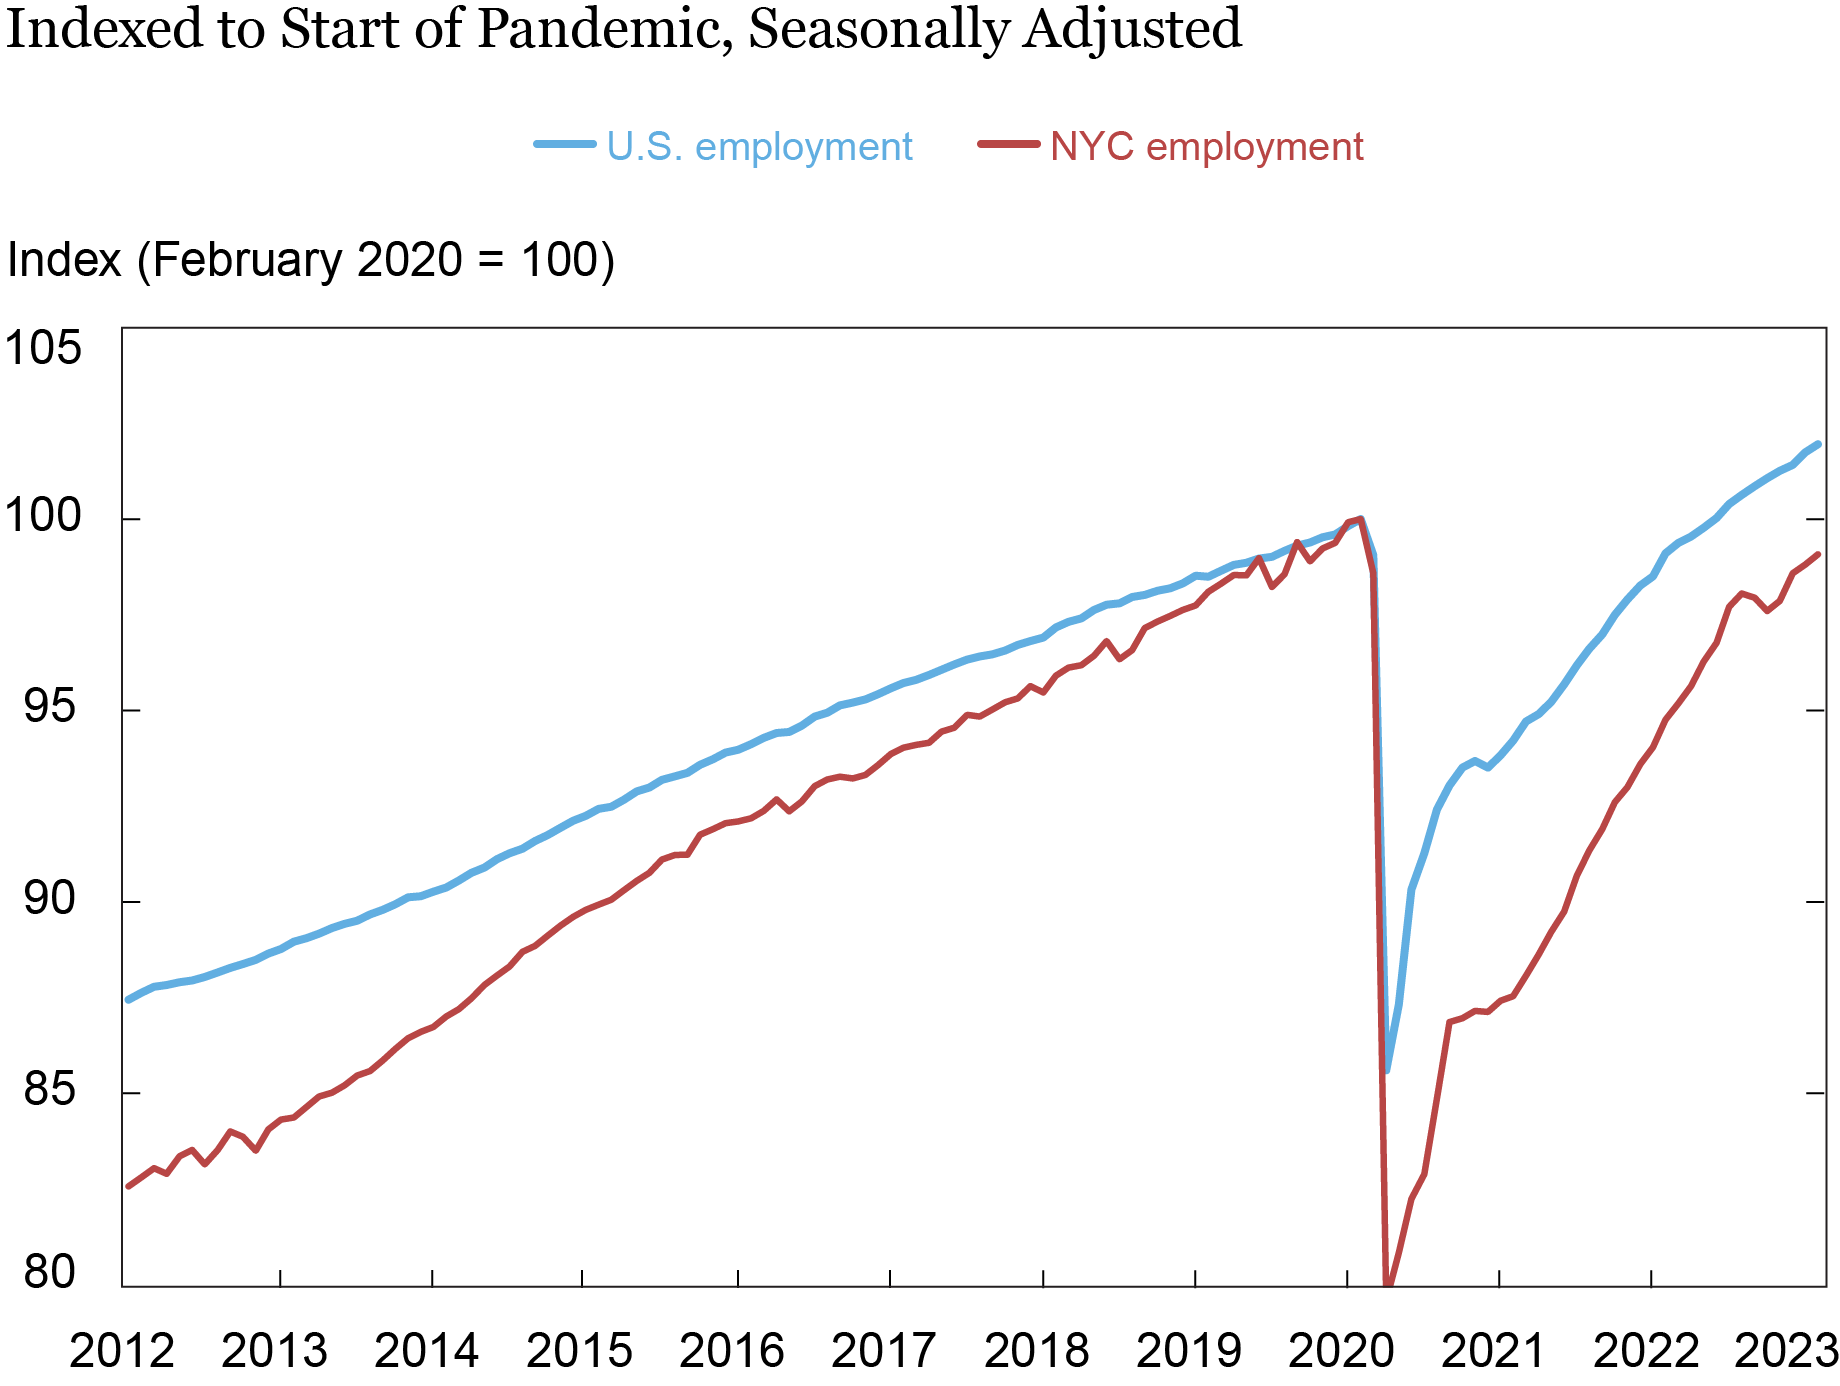
Note: The chart shows U.S. and New York City employment from January 2012 through
February 2023.
Within the city, though, the brunt of the job shortfall has accrued to Manhattan, where employment is still an estimated 3 percent below pre-pandemic levels. In contrast, employment in the outer boroughs has fully recovered overall. This is not too surprising, given that Manhattan accounts for most of the city’s office space and many of its tourist attractions: major museums, Carnegie Hall, Lincoln Center, Broadway theaters, the Empire State Building, and the Highline, as well as myriad music venues, galleries, and restaurants.
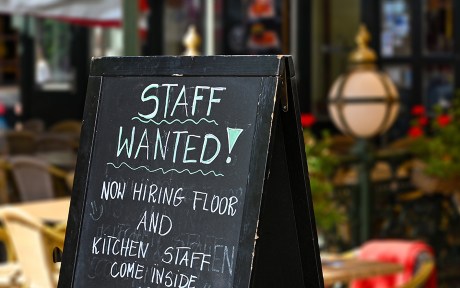
Even though Manhattan was hit hardest, it is not the core finance, business services, and tech sectors that have seen the brunt of the job loss. Rather, with much of these sectors’ office staff working remotely—and largely away from Manhattan’s commercial hubs—it is the many businesses that historically served office workers and visitors, as well as locals, that either shut down or saw business drop off sharply during the pandemic. While business in these sectors has rebounded strongly, it is still not back to normal, as evidenced by subway ridership, which remains down almost 30 percent from its pre-pandemic level. As of February, the lion’s share of New York City’s job shortfall accrues to the leisure and hospitality, personal services, and retail sectors.
So why has New York City as a whole lagged the nation in recovery? Is it partly due to people moving out? Not really. Geographic population estimates, based on the New York Fed’s quarterly Consumer Credit Panel, suggest that most of the dip in the city’s (and especially Manhattan’s) population early in the pandemic reflected a drop-off in people moving into the city, rather than a surge in people moving out. Then, starting around the fall of 2021, it appears that this net out-migration not only ceased but reversed course, as was evident from a strong rebound in residential rents and a pickup in home selling prices.
The Outlook for Commercial and Residential Real Estate
The initial outflux of residents and closing of businesses in the spring of 2020 jolted both the commercial and residential real estate markets. Retail and office vacancies surged, and rents fell. The same pattern was true for apartment vacancies and rents, though not to the same degree—in part due to a moratorium on evictions. While the residential rental market has bounced back, the retail and office markets have remained slack—largely due to the shift to remote work and online shopping. Although office vacancy rates have risen far more sharply in Manhattan than in most of the surrounding areas, the levels are now only comparable, because rates have historically been much lower in the central city. Similarly, Manhattan office rents are down sharply from their pre-pandemic levels but remain considerably higher than across the rest of the metro region. Thus, rather than a divergence in markets, there has been somewhat of a convergence, in terms of level. Still, the fact that the central city premium has retreated—albeit from very high levels—is not inconsequential. This weakening trend may continue as more and more commercial tenants roll off leases that were negotiated when demand for office and retail space was far stronger. It remains to be seen how these commercial real estate markets settle now that the pandemic appears to be behind us.
In the residential market, one striking element of the pandemic has been the divergence between urban and suburban/rural housing markets. Between February 2020 and February 2023, home prices (based on Zillow’s home price index) were up by about 10 percent in Manhattan versus 23 percent for the metro area overall. After adjusting for overall inflation, however, this works out to a 6 percent drop in Manhattan versus a 6 percent rise across the metro area. But even more interesting is that this divergence began well before the pandemic: Between June 2018 and February 2020, Manhattan home prices (inflation-adjusted) had already declined about 3 percent, versus an increase of just over 4 percent for the broader metro area. So does this mean that the premium value of living near or in the central business district has waned? In the short run, yes.
But to gain a better perspective, it is useful to take a longer-term view: Over the two decades leading up to the pandemic, after adjusting for inflation, home prices had increased by roughly 40 percent nationwide and by nearly 70 percent across the New York metro region; but in Manhattan, they had more than tripled, rising 240 percent, as shown in the chart below. Thus, as has been the case for the office market, what appears to be a divergence may be more of a convergence, with the outlying counties closing a bit of the yawning gap with the central city.
New York City Home Prices Still Exceptionally High
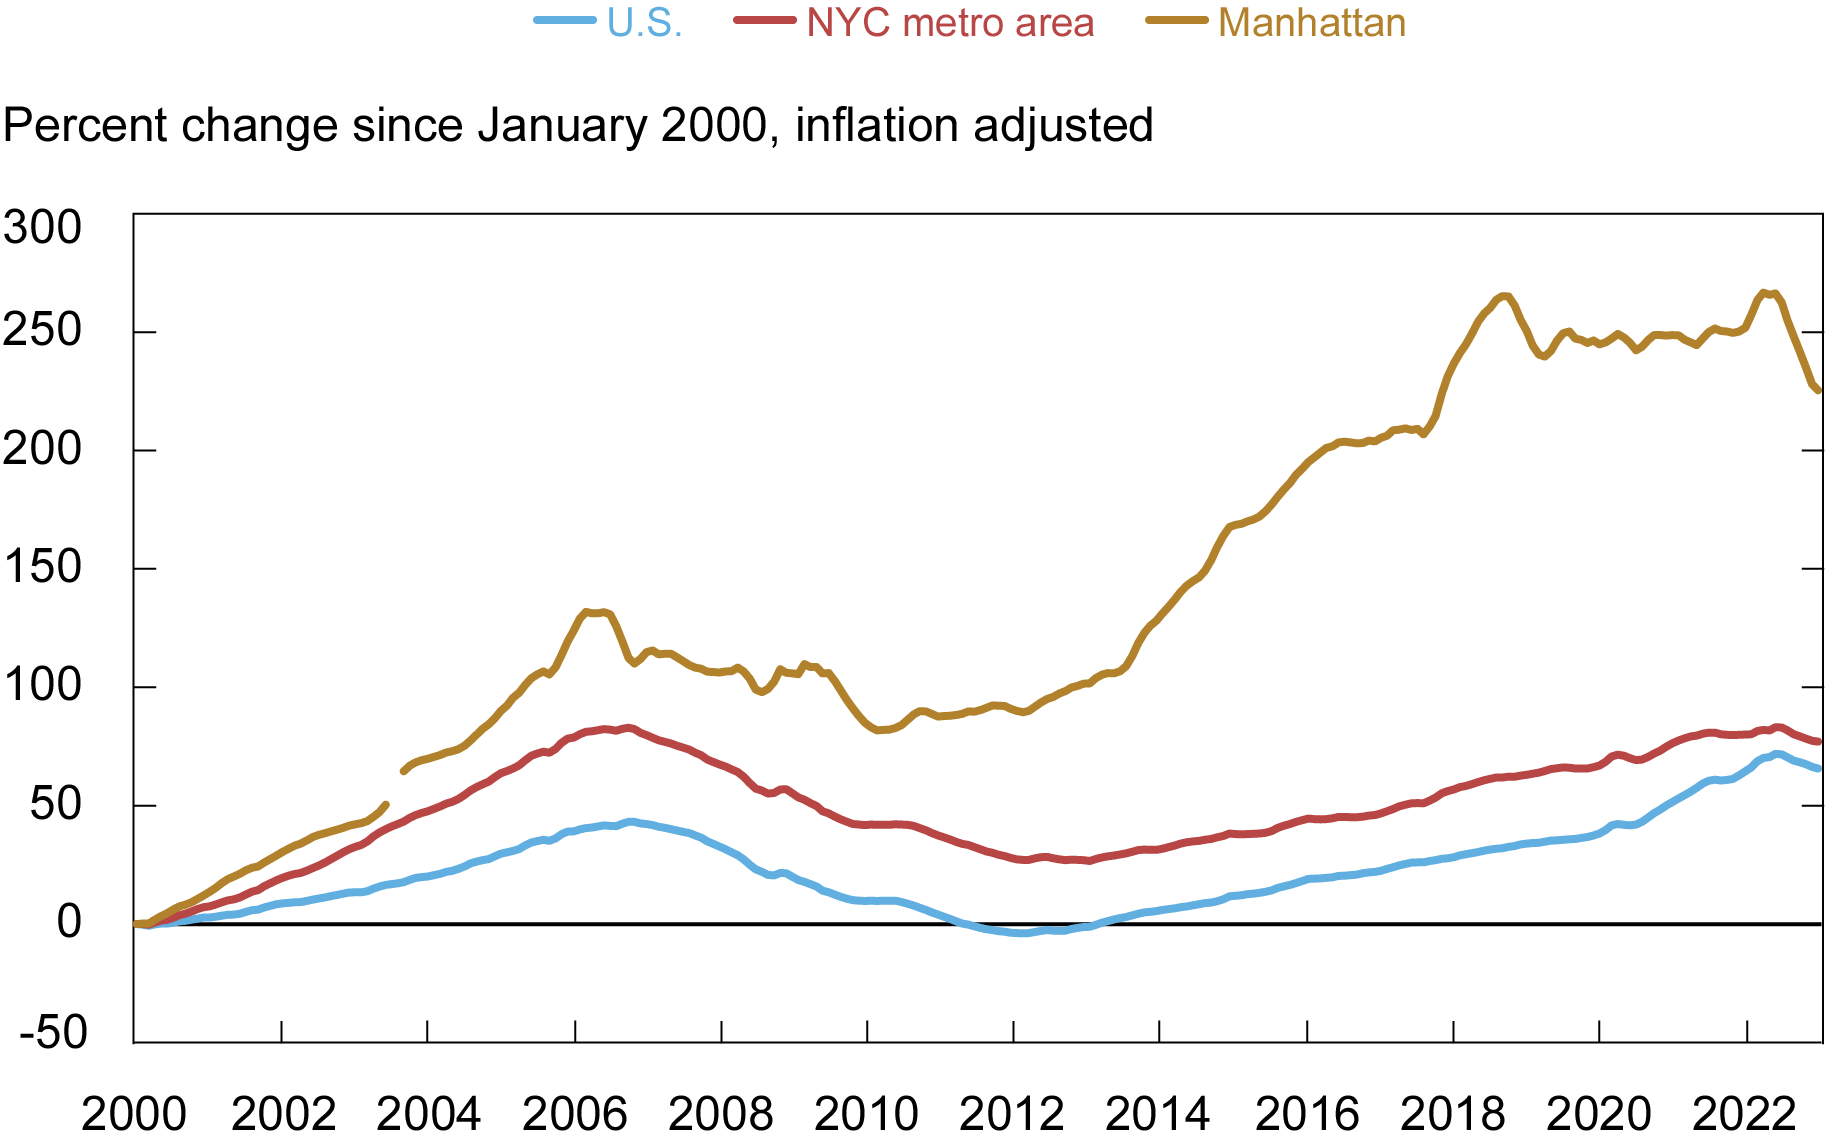
Note: The chart shows home prices for Manhattan, the New York metropolitan area, and the
U.S. from January 2000 through February 2023.
More broadly, the land price gradient across cities—that is, the rate at which land value diminishes as one moves away from the center—appears to have lessened a bit but has remained steep, both in absolute terms and relative to a few decades ago. While Manhattan home prices and rents have both receded in recent months, both are still at exceptionally high levels, relative to the metro area overall—let alone relative to the nation as a whole.
Conclusion
The “suburbanization” of the United States over the second half of the twentieth century showed signs of reversing over the past two decades as the economies of central cities, notably New York, outperformed their counterparts. While there are signs that the pandemic, which targeted dense cities in particular, caused some reversal in this trend, it remains to be seen what post-pandemic trends emerge. Our companion post will explore the fallout from the pandemic on employment trends across the broader region.

Jason Bram is an economic research advisor in Urban and Regional Studies in the Federal Reserve Bank of New York’s Research and Statistics Group.
How to cite this post:
Jason Bram, “How Did New York City’s Economy Weather the Pandemic?,” Federal Reserve Bank of New York Liberty Street Economics, April 13, 2023, https://libertystreeteconomics.newyorkfed.org/2023/04/how-did-new-york-citys-economy-weather-the-pandemic/
BibTeX: View |
Disclaimer
The views expressed in this post are those of the author(s) and do not necessarily reflect the position of the Federal Reserve Bank of New York or the Federal Reserve System. Any errors or omissions are the responsibility of the author(s).
 RSS Feed
 Follow Liberty Street Economics