


Settlement fails in corporate securities increased sharply in 2022, reaching levels not seen since the 2007-09 financial crisis. As a fraction of trading volume, fails that involve primary dealers reached an all-time high in the week of March 23, 2022. In this post, we investigate the 2022 spike in settlement fails for corporate securities and discuss potential drivers for this increase, including trading volume, corporate issuance, fails in bond ETFs, and operational problems.
Settlement Fails: What Are They and Why Do They Matter?
Settlement fails refer to instances in which one counterparty of a trade fails to deliver or receive securities on the settlement date of the transaction. Fails occur for a variety of reasons having to do with operational issues (for example, miscommunication about the terms of a trade or incorrect booking of a trade), incentives (for example, when the cost of failing is low), and market conditions (for example, short selling a bond that is difficult to locate or in scarce supply).
Settlement fails are a concern because they can lead to a buildup of counterparty credit risk and have the potential to negatively impact market liquidity. A buyer who fails to receive securities, for example, may suffer a loss if the seller defaults before delivery and the security price increases. Some market participants must also absorb capital charges when fails become “aged” or persist for more than a few weeks. This diverts capital from other uses, imposing an opportunity cost on market participants and potentially depressing liquidity if market-making activities are thereby curtailed. In addition, if fails become widespread, security owners may become reluctant to lend out of a concern that lent securities will not be returned, further worsening market conditions.
History of Corporate Fails
In this post, we use the FR 2004 statistical release to measure settlement fails in corporate securities that involve primary dealers. Corporate fails have been infrequent but persistent, dating back to the early 2000s. Summing across primary dealers, fails-to-deliver averaged $3.8 billion per day and fails-to-receive averaged $3.0 billion per day from July 4, 2001, to December 28, 2022. Trading volume in corporate securities, covering the same securities and dealers as the fails data, averaged $131.6 billion over the same period. In interpreting these amounts, note that the definition of corporate securities in FR 2004 includes bonds and commercial paper, and that trades between primary dealers are reported by each side. That is, the trading volume and fails statistics are higher than they would be for corporate bonds alone.
The chart below shows the historical time-series of fails-to-deliver and fails-to-receive against trading volume. There are several features to note. First, settlement fails are common, occurring in every week in the sample. Second, fails-to-deliver and fails-to-receive are highly correlated. This observation is mechanical for trades between primary dealers but not for trades with customers or non-primary dealers. Third, fails tend to be higher when trading volume is higher. Fails and trading volume increased around the 2007-09 financial crisis, the COVID-19 crisis, and more recently in 2022.
Corporate Security Fails Are Correlated with Trading Volume
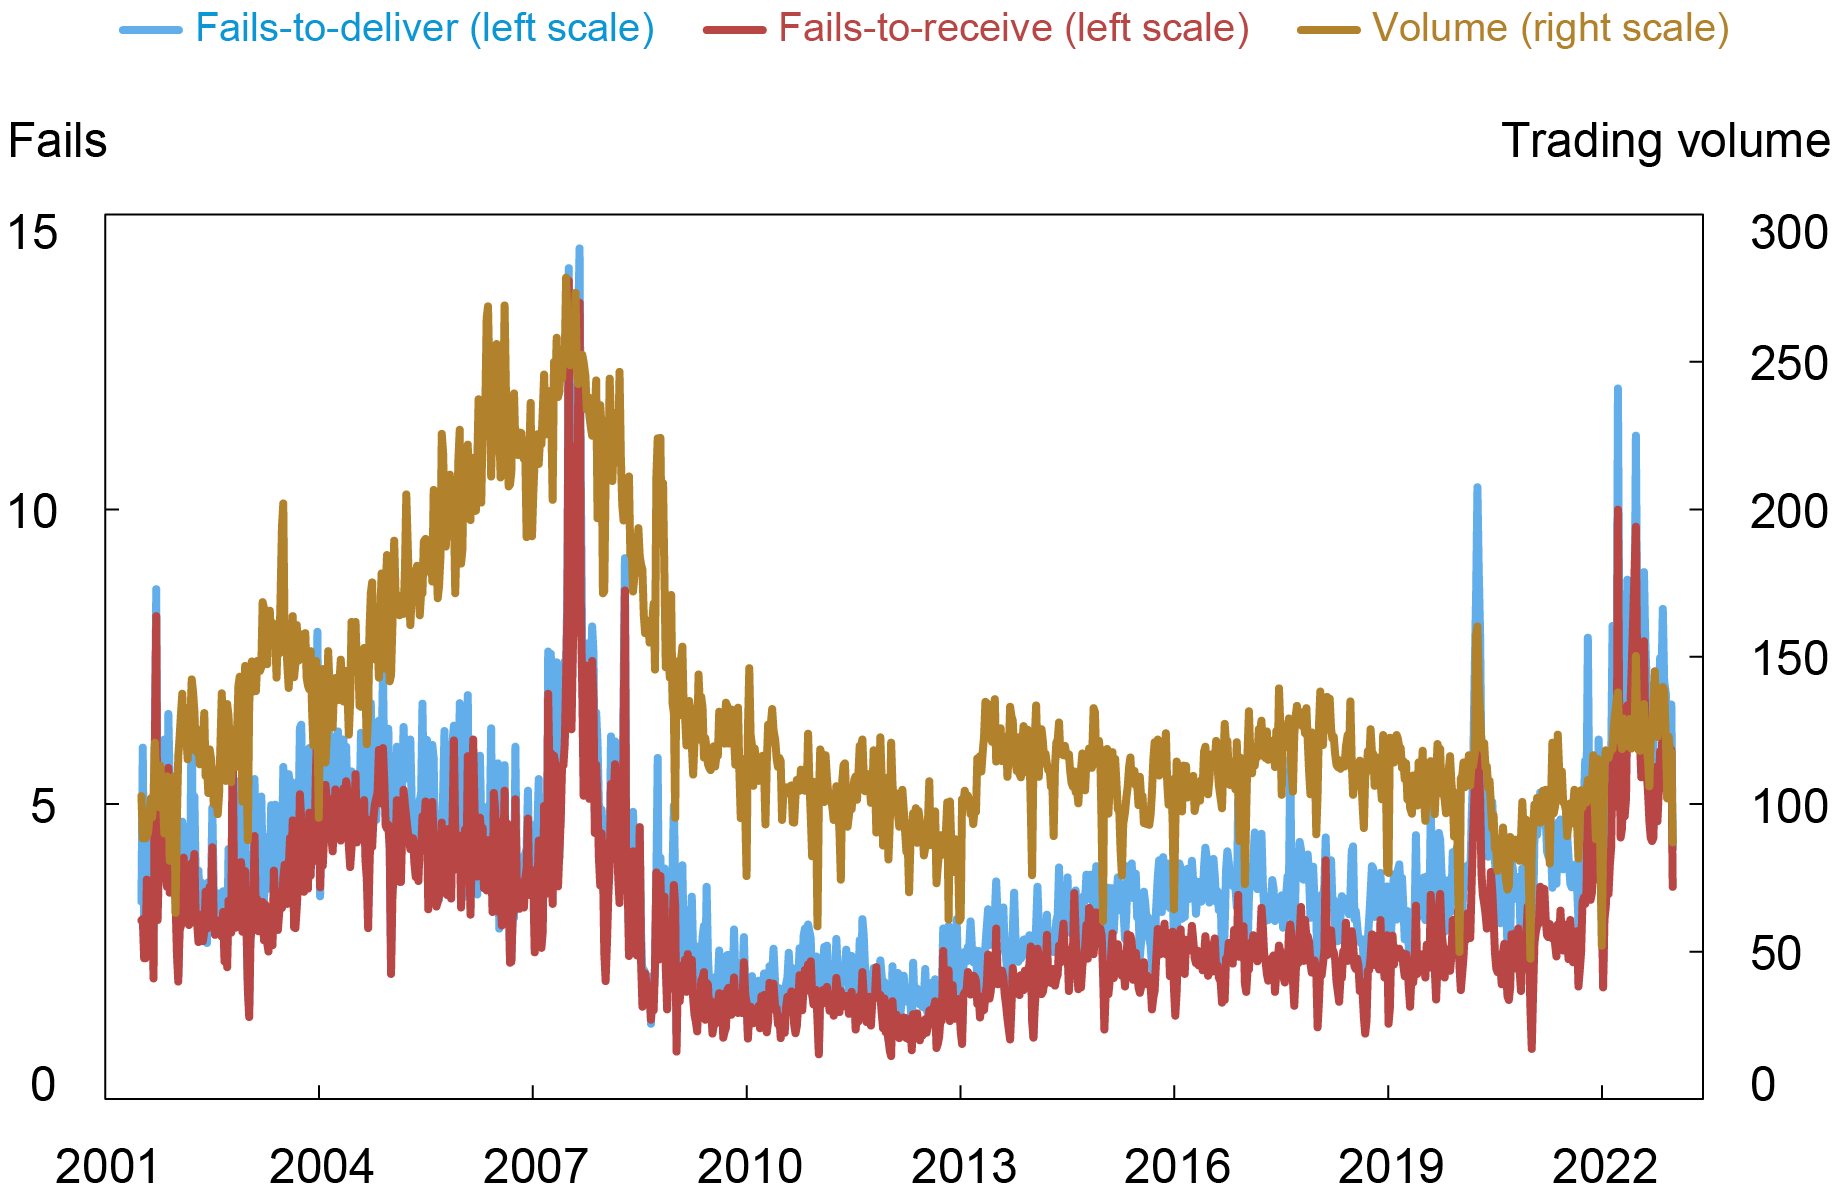
Notes: The chart plots primary dealers’ average daily fails-to-deliver, fails-to-receive, and trading volume by week in billions of dollars. The weekly fails data is reported on a cumulative basis that increments the failed amount until settlement occurs. For example, if a dealer fails to deliver $10 million of securities to a customer on Thursday, but makes delivery one day late on Friday, the dealer reports $10 million in fails to deliver. If delivery is four days late on Monday, the dealer reports $40 million in fails to deliver. Fails to receive are counted in an analogous manner. The data does not distinguish aged fails from new fails, even though aged fails may be more concerning from a counterparty risk perspective. The FR 2004 definition of corporate securities included non-agency MBS (“other MBS”) through March 2013. Since this includes most of our sample, we include non-agency MBS in the corporate securities fails and trading volume measures throughout the post to have consistent series over time. Since April 2013, non-agency MBS has comprised 12 percent of fails in the combined measure
Given the relationships discussed above, we focus on the average of failures-to-deliver and failures-to-receive (called “fails” for simplicity) in the remainder of the post. The next chart plots fails as a fraction of trading volume. We see that in 2022 corporate fails as a fraction of trading volume increased to levels not seen since the early 2000s and reached an all-time high of 8 percent in the week of March 23, 2022. In that same week, fails reached their highest level on an absolute basis outside of the 2007-09 financial crisis.
Corporate Fails All-Time High as Fraction of Trading Volume on March 23, 2022
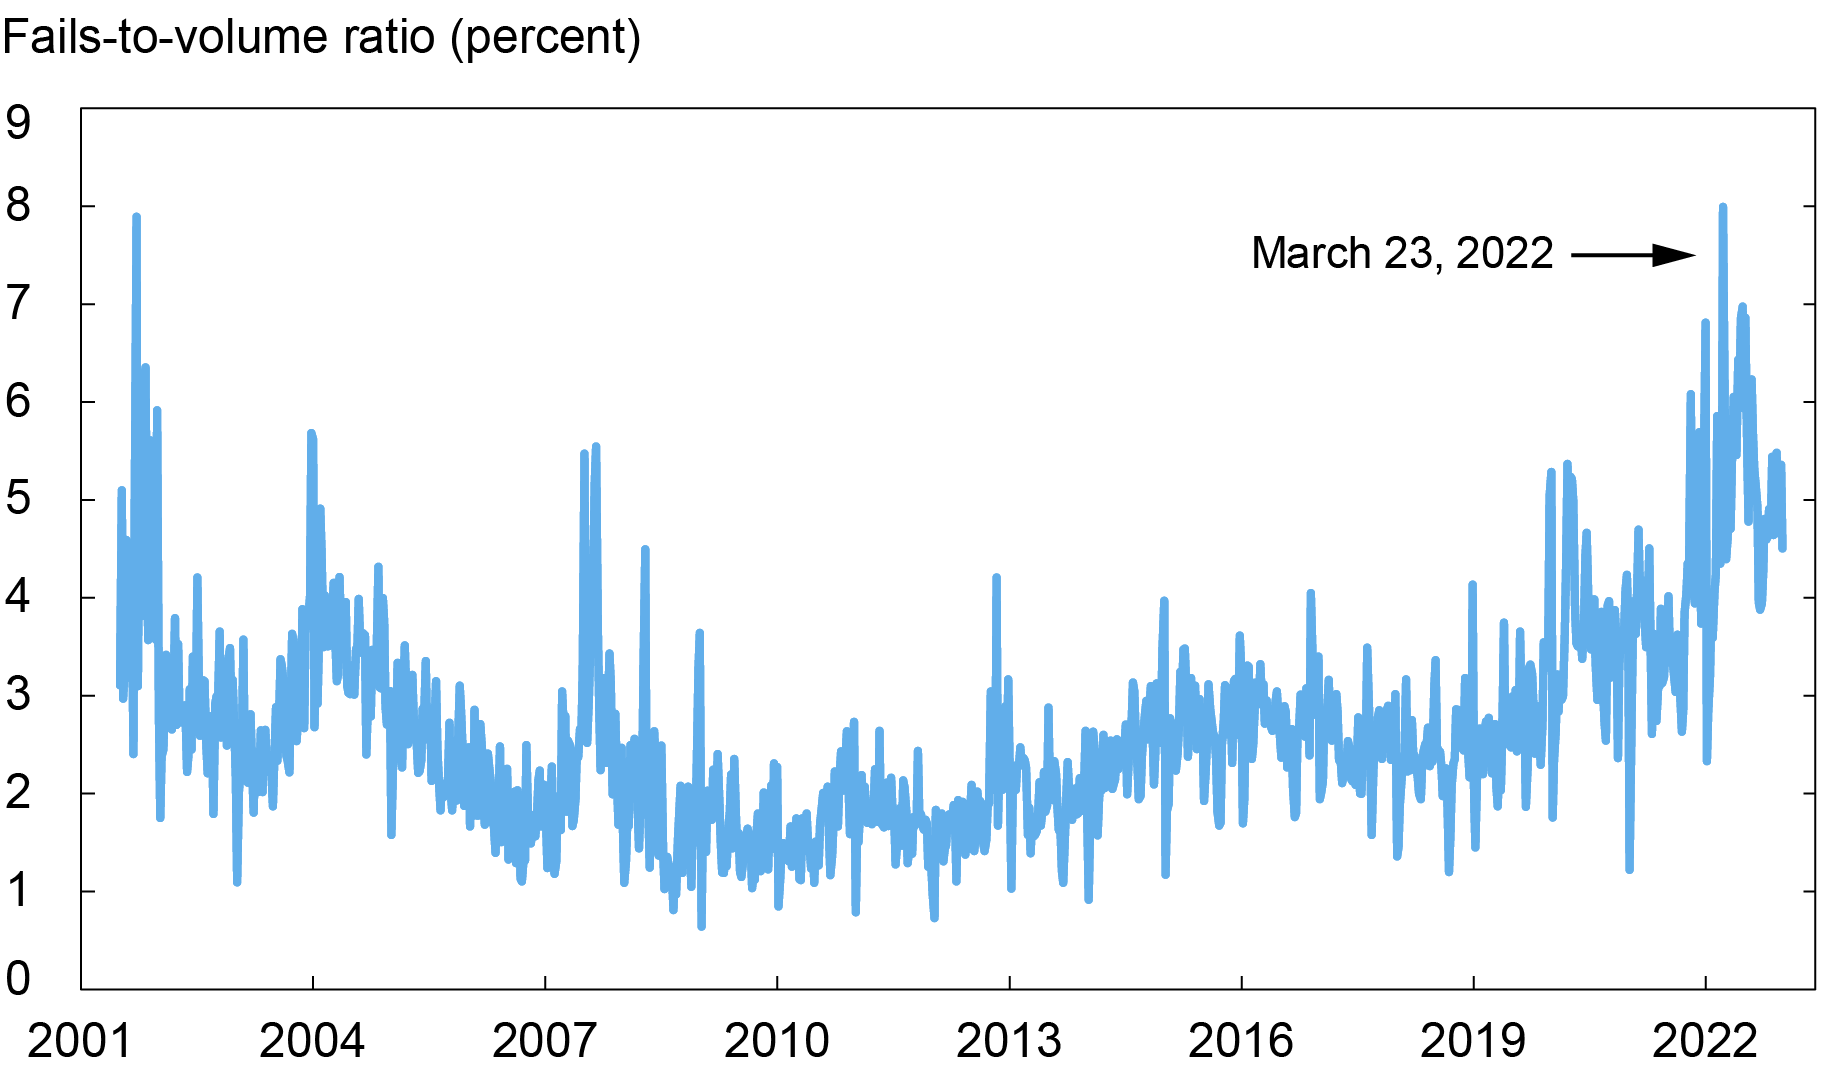
Notes: The chart plots primary dealers’ average daily corporate security settlement fails divided by primary dealers’ average daily corporate security trading volume on a weekly basis. Fails are defined as the average of fails-to-deliver and fails-to-receive.
Fails in Corporates Relative to Other Securities
While the recent spike in fails for corporate securities appears large in isolation, it is relatively small compared to the spikes in the Treasury market that motivated the introduction of a fails charge in May 2009. To put the size of corporate fails in context, the chart below reports fails normalized by trading volume for different security types. Fails declined significantly for Treasury securities, agency MBS, and agency securities after the introduction of their respective fails charges. For corporate securities, fails have been relatively low and stable until recently. The chart shows that the increase in corporate fails compared to other securities began around the onset of the COVID-19 crisis and persisted into 2022, albeit at a lower level than the large levels of fails observed earlier in the sample period that motivated the introduction of fails charges for other securities.
Corporate Securities Exhibit High Fails Compared to Other Securities in 2022
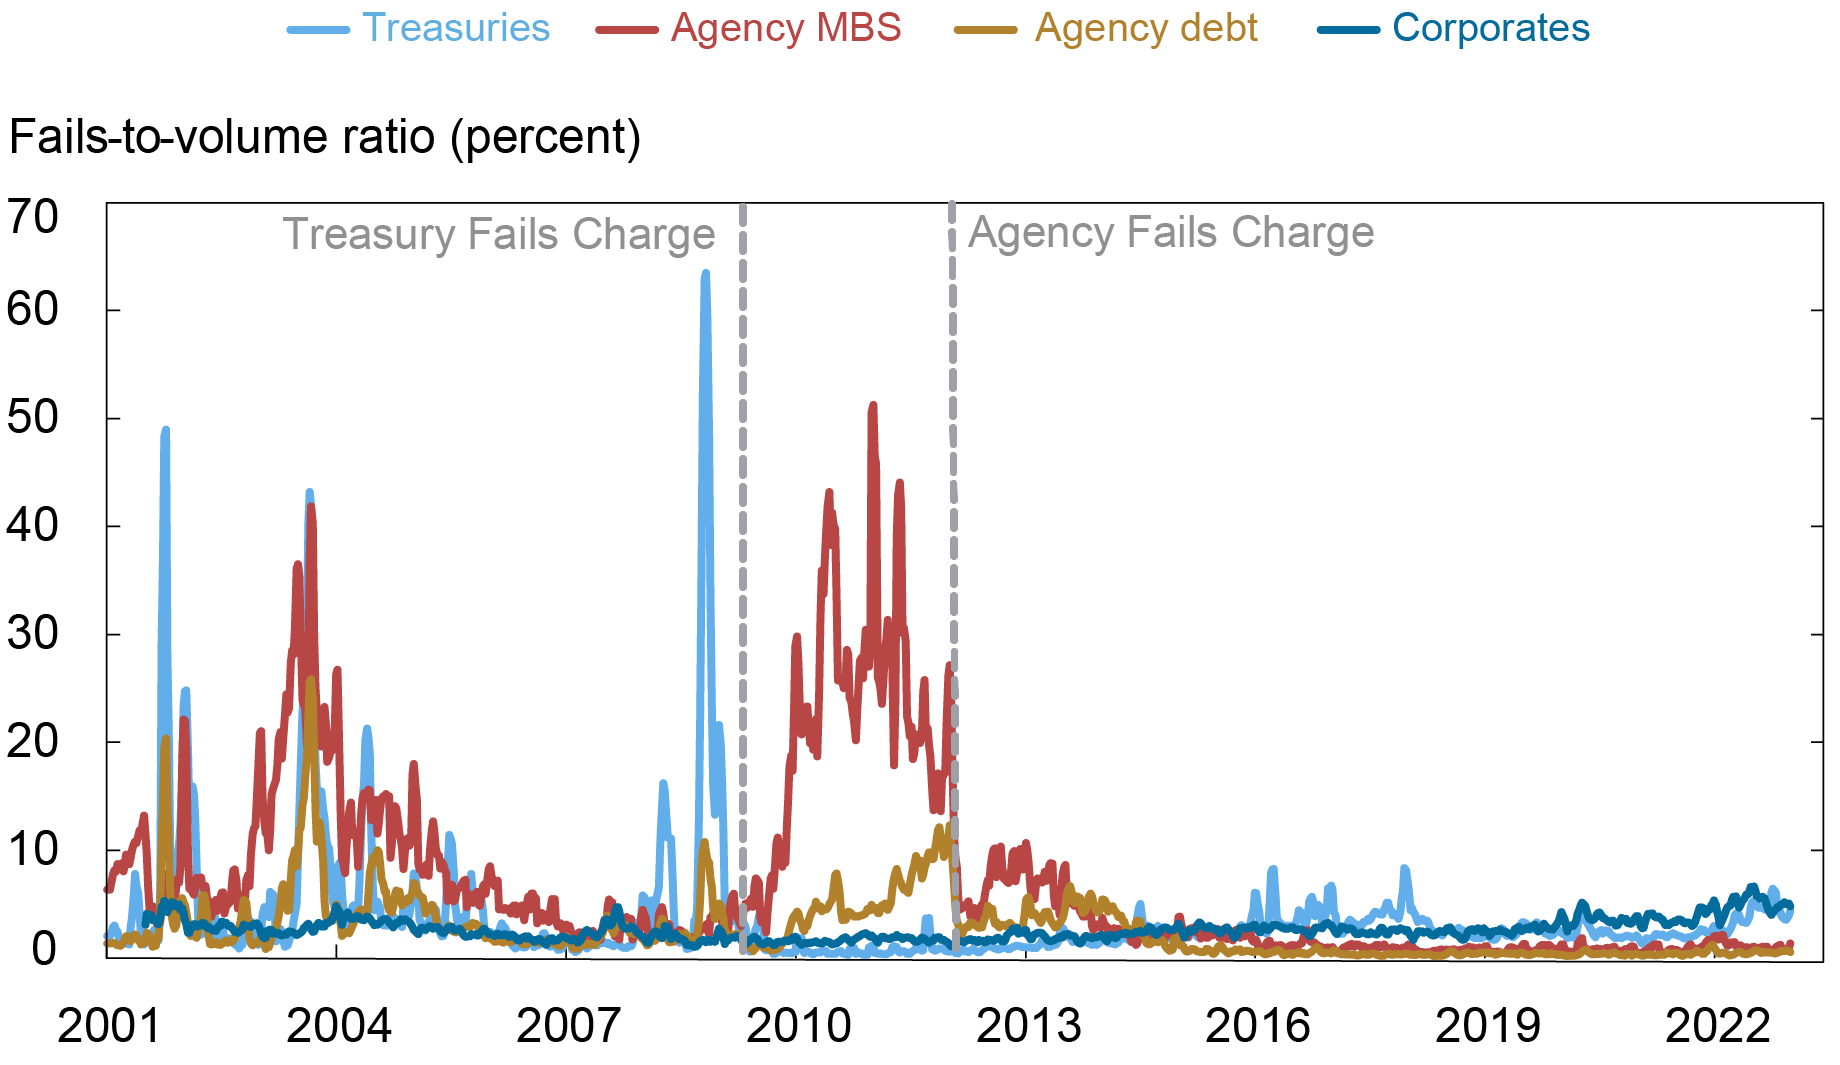
Notes: The chart plots a four-week moving average of primary dealers’ average daily settlement fails divided by primary dealers’ average daily trading volume for U.S. Treasuries, agency MBS, agency debt securities, and corporate securities.
Drivers of Corporate Fails
What drives corporate fails? If there was a constant probability of failing on any given trade, the relationship with volume would be largely mechanical. However, there may be other channels that drive fails or amplify the relationship with volume. For example, higher trading volumes may be associated with increases in operational complexity or with increases in market stress and counterparty credit risk.
One potential driver of fails is the issuance of corporate bonds. Newly issued bonds trade frequently in the days after issuance. Higher trading volumes may lead to more fails as discussed above. In addition, new bonds may become scarcer and harder to locate as they go through the process of being intermediated between dealers and long-term holders. Countervailing these effects, settlement dates for new issues are often one or two weeks after issuance, providing more time to settle than a typical trade. The top left panel in the chart below shows that total issuance declined from the record levels that followed the onset of the COVID-19 pandemic, whereas corporate fails remained elevated. This suggests that new issuance is unlikely to have been the main cause of increased fails in 2022.
Another possibility is that, due to arbitrage, fails in bond ETFs and the cash bond market are linked. Suppose that a bond ETF is cheap relative to the redemption basket of the underlying bonds. An ETF arbitrageur may buy the ETF and short sell the underlying bonds to capture the arbitrage spread. If the arbitrageur fails to receive the ETF, the arbitrageur may be unable to deliver the ETF for the underlying bonds that were sold short. The top right panel in the chart below shows that fails in bond ETFs have increased alongside corporate fails, with both measures trending up in recent years. However, bond ETF fails are small in magnitude compared to corporate fails and ETF fails may occur for other reasons than arbitrage trades. In 2022, aggregated fails in the largest investment grade and high yield bond ETFs averaged around $190 million per day versus $6.2 billion per day for corporate securities, pointing to a limited association between the two. In addition, bond ETF fails cannot explain the higher values of corporate fails that occurred earlier in the sample.
Finally, we explore whether the increase in corporate fails can be explained by idiosyncratic operational problems at a small number of dealers. To proxy for idiosyncratic problems, the chart below reports a Herfindahl-Hirschman index (HHI) for corporate fails across the primary dealers. Higher values indicate that fails are more concentrated at a few dealers. While the HHI measure has increased mildly in recent years, these increases do not bring the HHI measure near the high values that were observed earlier in the sample. As a robustness check, we confirm that similar results hold when looking at the percent of fails accounted for by the top one, three, and five primary dealers each week. According to either the HHI measure or the top shares, the increase in corporate fails in March 2022 is not explained by a small number of dealers. In addition, we do not find an increase in corporate fails after the change from T+3 to T+2 settlement in 2017, pointing against fails being driven by heightened operational risks stemming from a tighter settlement window.
Considering these explanations together, if we regress corporate fails onto trading volume, corporate issuance, bond ETF fails, the Herfindahl measure of corporate fails, and indicator variables to control for monthly and year-end seasonal patterns, we can explain around 60 percent of the variation in corporate fails. The bottom right panel in the chart below plots fails against the fitted value from the regression model. In 2022, actual fails exceeded the fitted value by the largest amount in recent years, with the regression model explaining around half of the rise in fails.
Issuance, ETF Activity, and Idiosyncratic Factors Help Explain Fails
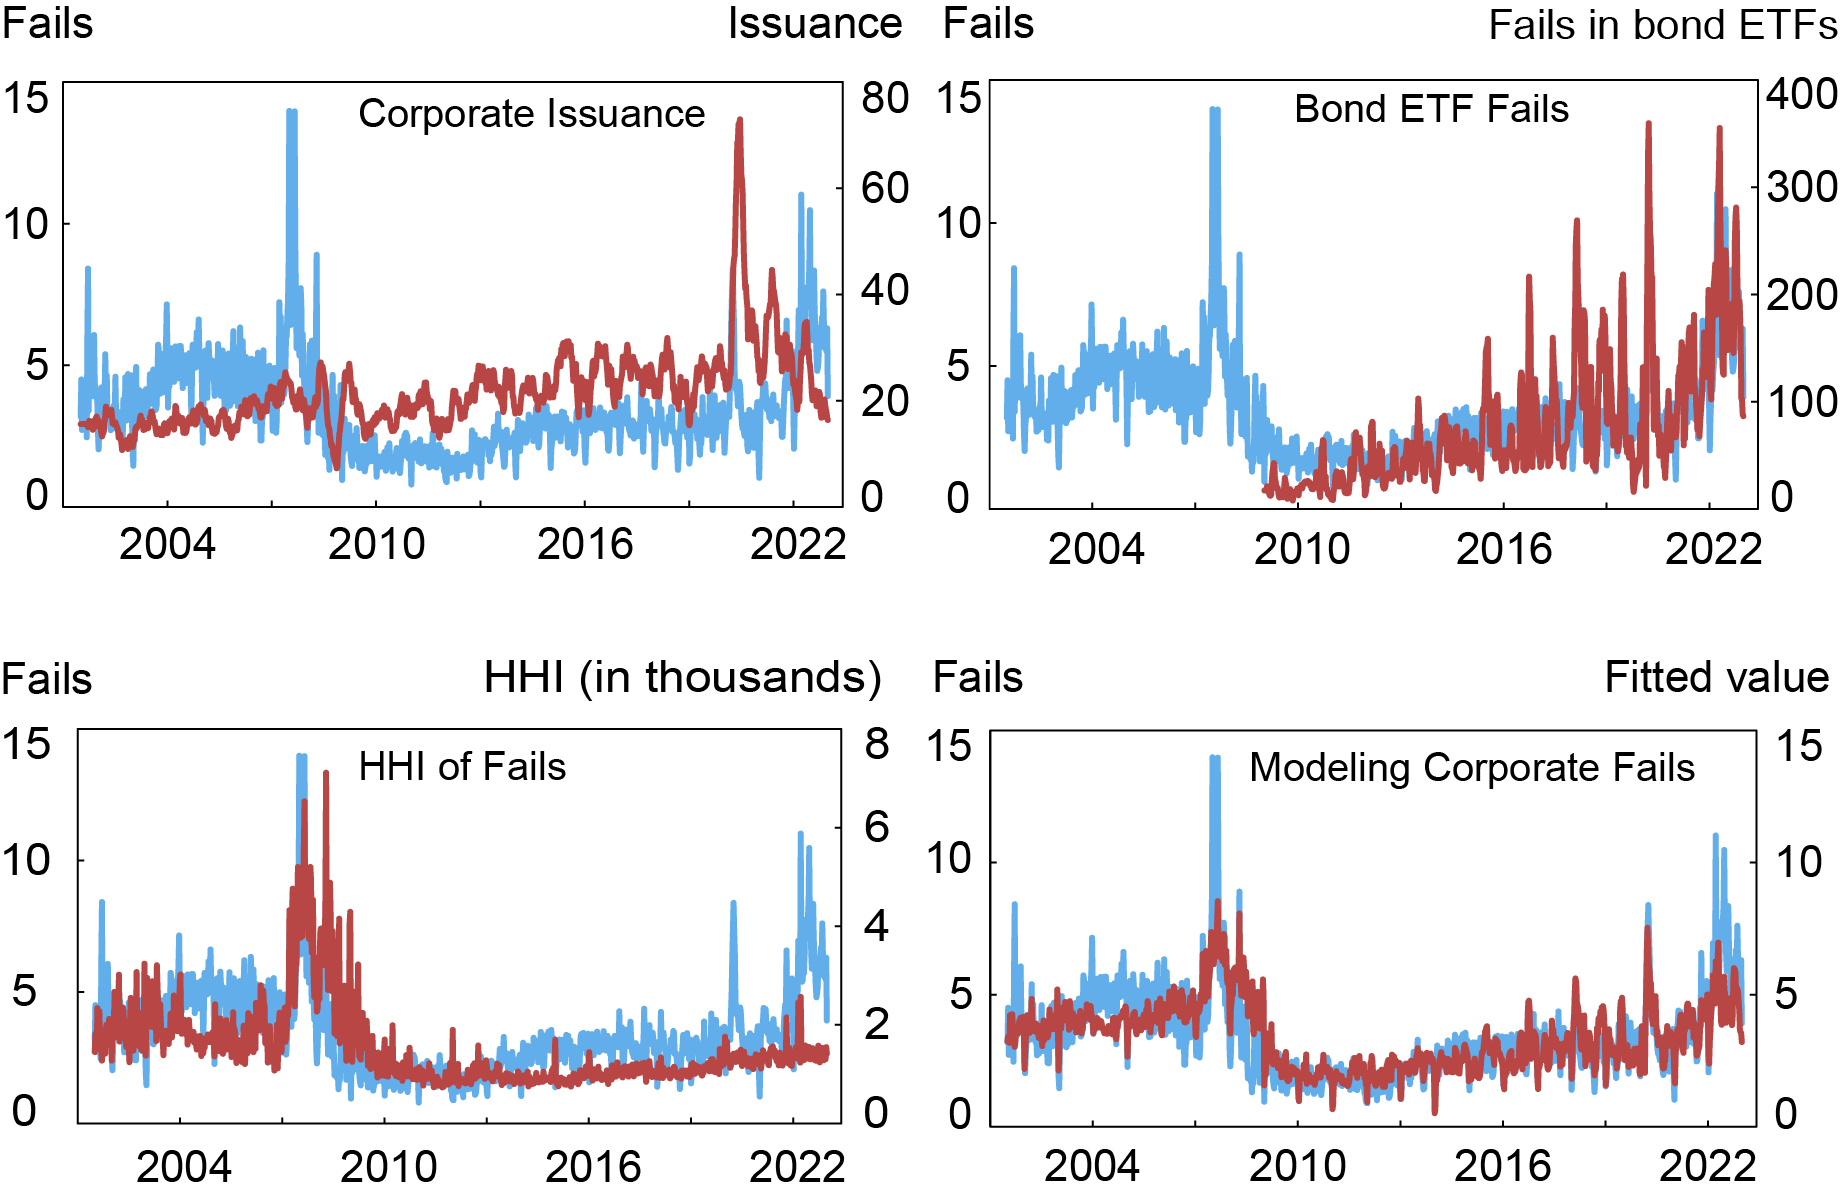
Notes: The chart plots average daily corporate fails (blue) in billions per day against (i) corporate issuance in billions per week as a twelve-week moving average, (ii) bond ETF fails in millions per day as a twenty-one trading day moving average for the largest investment grade and high yield bond ETFs by market capitalization, (iii) an HHI measure that equals the sum of squared weekly shares of fails across primary dealers multiplied by 10,000, and (iv) the fitted value from a regression model that controls for trading volume, corporate issuance, bond ETF fails, the HHI measure, and seasonal effects. We calculate weekly new issuance as of the end of Wednesday and apply the following conditions to better align with the FR 2004 definition of corporate securities: include only corporate bonds that are USD denominated issues, include only bonds by U.S. domiciled issuers, and exclude non-convertible bonds and issues with zero offering amount.
Settling Up
Settlement fails for corporate securities reached an all-time high in 2022 as a fraction of trading volume. After exploring potential drivers of corporate fails, we can explain only about half of the 2022 increase in fails. One limitation in this analysis is the lack of CUSIP-level fails data for corporate securities, which would allow for more precise identification of the different channels driving fails. Regardless, while corporate fails were elevated in 2022, they remained well below the historical levels of fails in Treasury, agency, and agency MBS markets that motivated the introduction of fails charges for those securities.

Michael J. Fleming is the head of Capital Markets Studies in the Federal Reserve Bank of New York’s Research and Statistics Group.

Or Shachar is a financial research advisor in Capital Markets Studies in the Federal Reserve Bank of New York’s Research and Statistics Group.

Peter Van Tassel is a financial research economist in Capital Markets Studies in the Federal Reserve Bank of New York’s Research and Statistics Group.
How to cite this post:
Michael J. Fleming, Or Shachar, and Peter Van Tassel , “The 2022 Spike in Corporate Security Settlement Fails,” Federal Reserve Bank of New York Liberty Street Economics, April 10, 2023, https://libertystreeteconomics.newyorkfed.org/2023/04/the-2022-spike-in-corporate-security-settlement-fails/
BibTeX: View |
Disclaimer
The views expressed in this post are those of the author(s) and do not necessarily reflect the position of the Federal Reserve Bank of New York or the Federal Reserve System. Any errors or omissions are the responsibility of the author(s).
 RSS Feed
 Follow Liberty Street Economics