


With prices quickly going up after the COVID-19 pandemic, inflation releases have rarely been as present in the public debate as in recent years. However, since inflation estimates are frequently revised, how precise are the real-time data releases? In this Liberty Street Economics post, we investigate the size and nature of revisions to inflation. We find that inflation estimates for a given month can change substantially as subsequent data vintages are released. As an example, consider March 2009. With the economy contracting amid the Global Financial Crisis, the twelve-month inflation rate for personal consumption expenditures (PCE) excluding food and energy dropped from an initial estimate of 1.8 percent to 0.8 percent in the current series. The difference is dramatic and points to the difficulty of monitoring inflation in real time. Our results suggest that there is significant uncertainty in measuring inflation, and the key features of the recent spike and subsequent moderation of inflation may look quite different in hindsight once further revisions have taken place.
Historical Revisions to the PCE Price Index
There are two main measures of consumer price inflation in the United States: the PCE price index and the consumer price index (CPI). Measuring inflation accurately is challenging because it relies on extensive data collection, seasonal and other adjustments, and imputations. As a result, both the PCE price index and the (seasonally adjusted) CPI are revised over time. We begin by analyzing the PCE price index—the Federal Open Market Committee’s preferred inflation gauge—and document that the magnitude of these revisions is often substantial. This can be seen in the chart below which presents revisions to core PCE inflation, that is, inflation in PCE excluding food and energy components. In this post we focus on core inflation to show that revisions are not confined to the more volatile components.
Core PCE Inflation Revisions Can Be Sizable
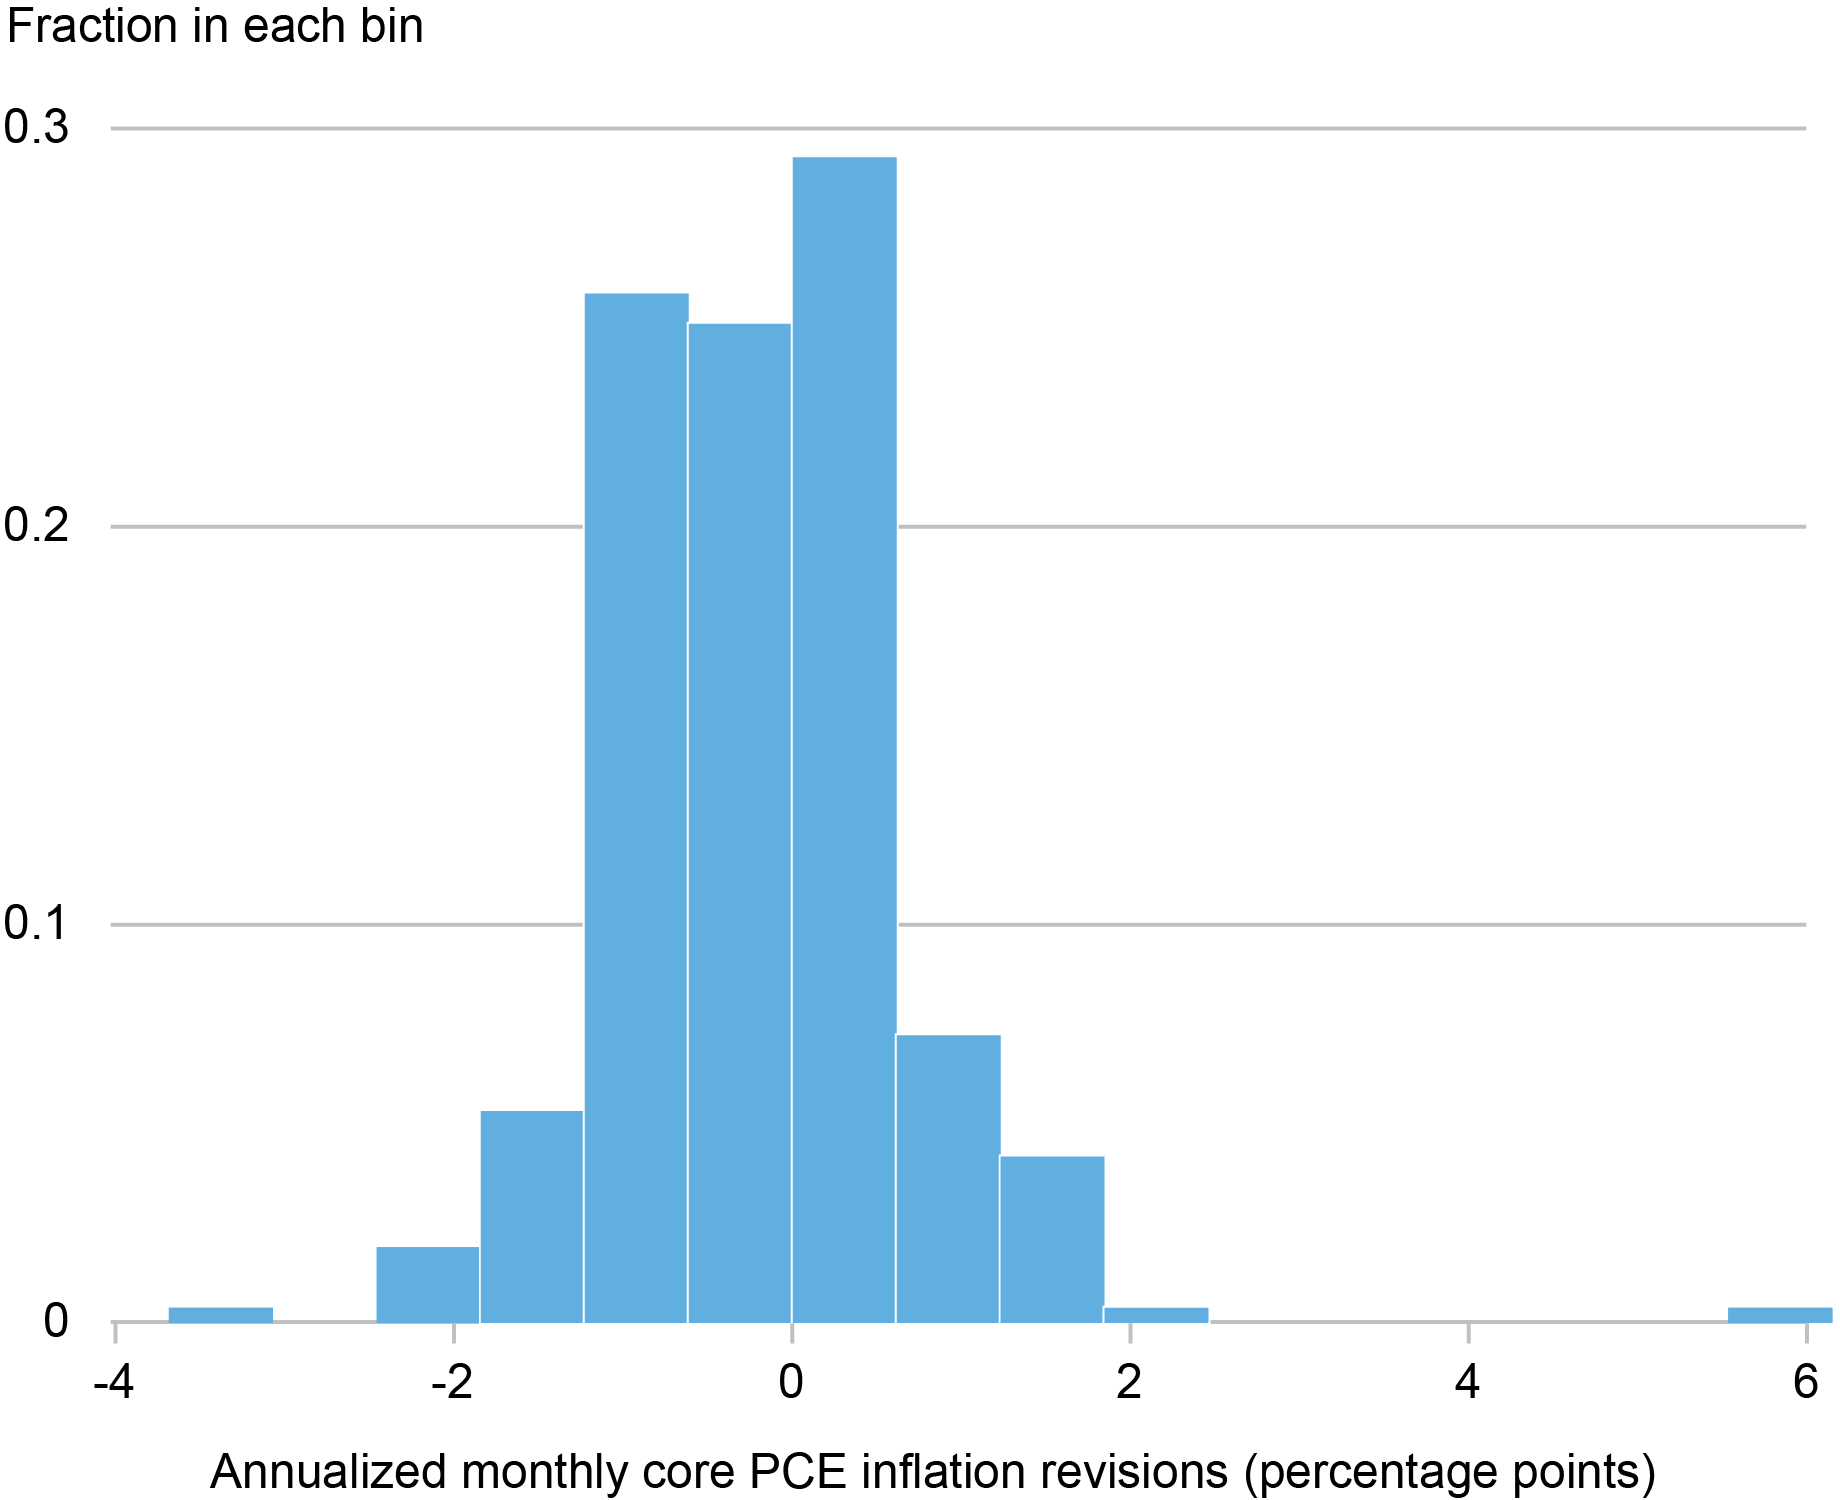
Notes: The vertical axis is the fraction of inflation revisions falling in each bin. For example, 25 percent of inflation rates were revised down between 0 and 0.6 percentage points.
In other words, estimates of annualized monthly inflation in core PCE since 2001 were revised by as much as 6 percentage points and more than 15 percent of the revisions have been greater than one percentage point. Revisions are not only sizable but occur repeatedly since the Bureau of Economic Analysis (BEA) revises PCE as part of the National Income and Product Accounts revision process. For example, the September 2018 number has been revised five times following its initial release: twice in the following months and three times further in July 2019, July 2020, and July 2021.
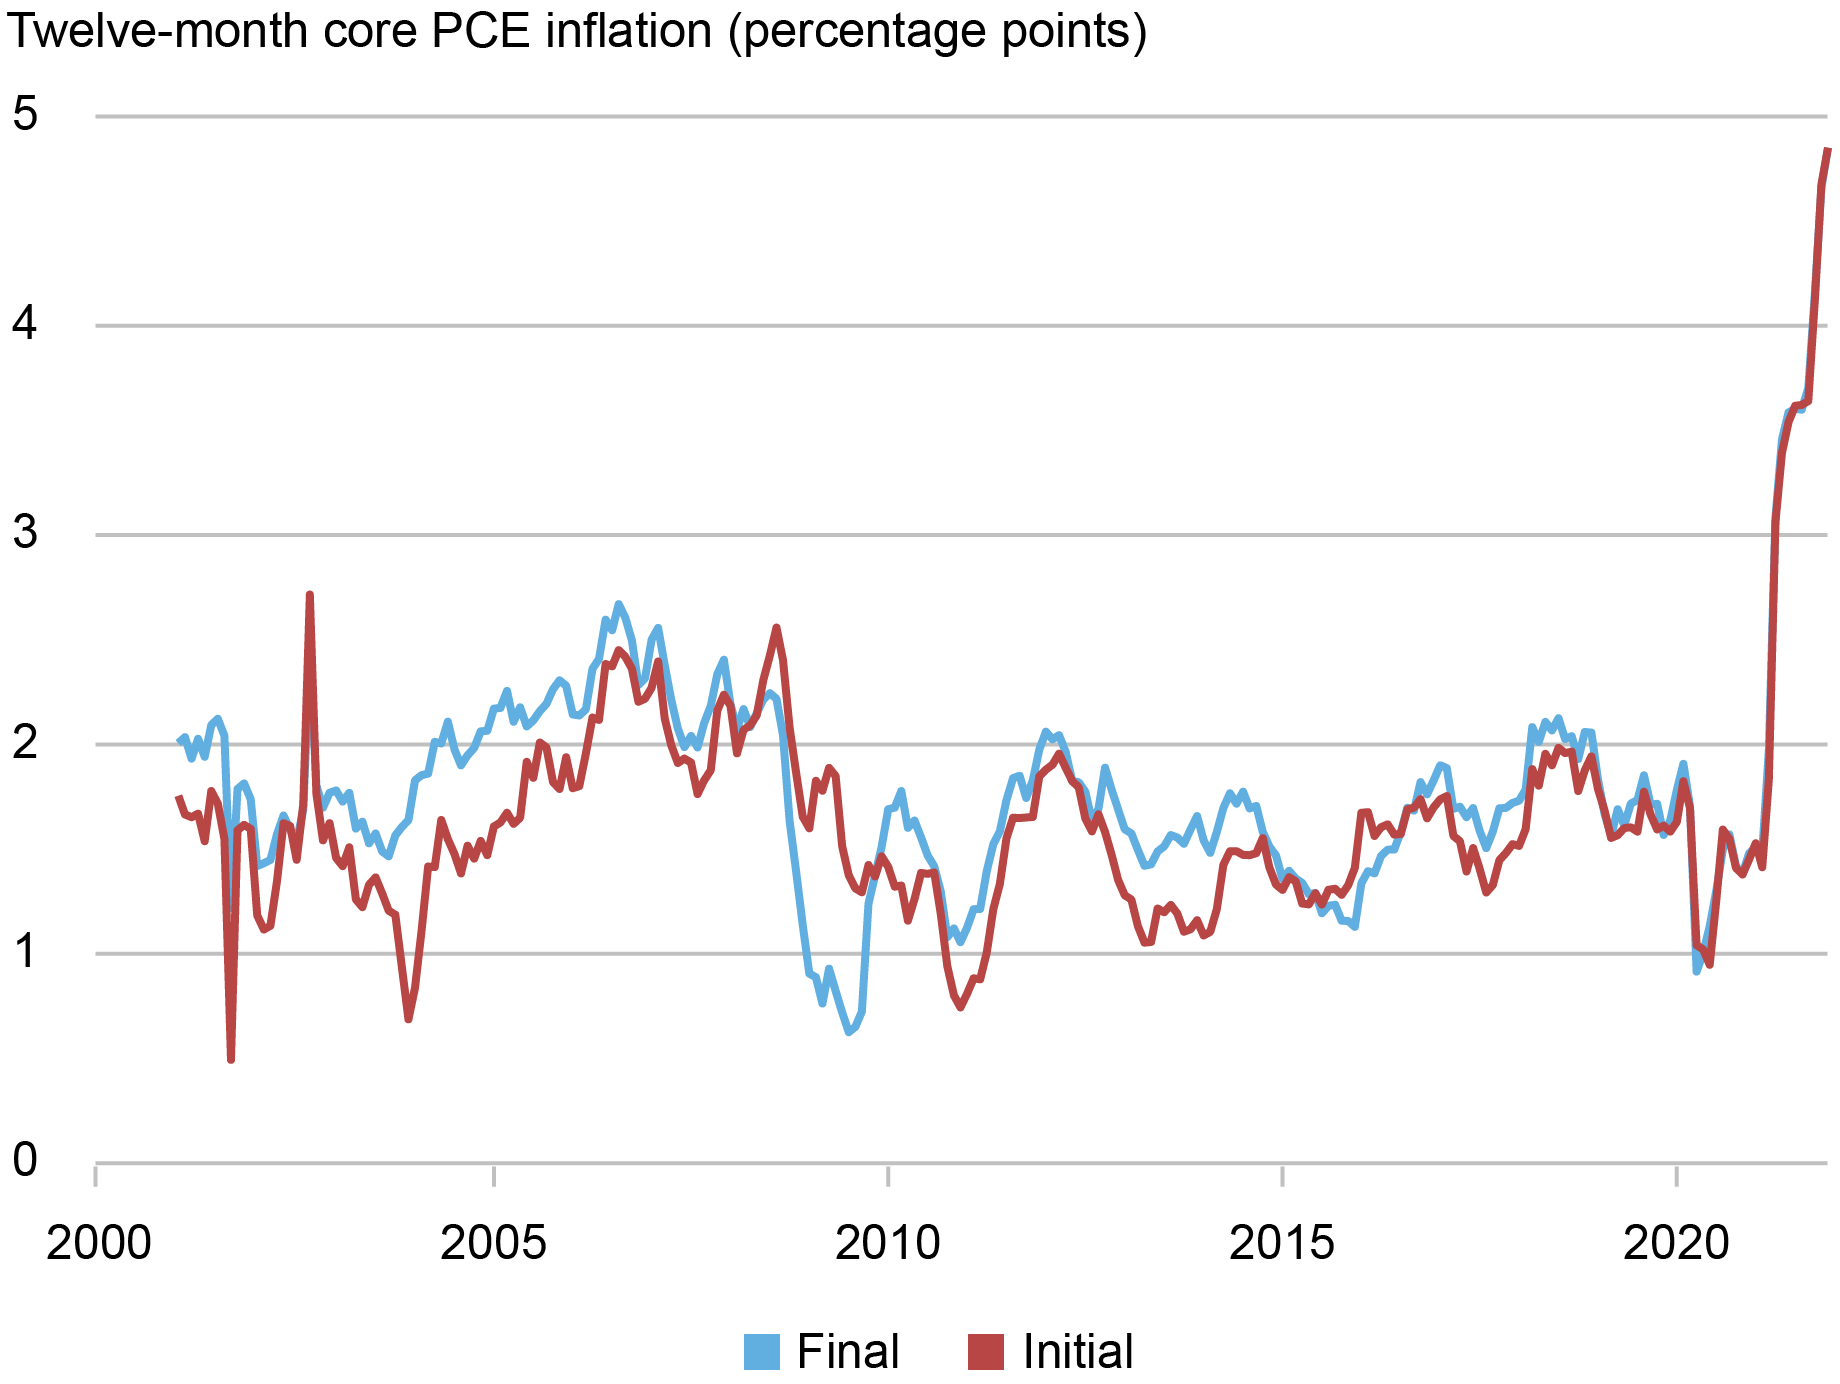
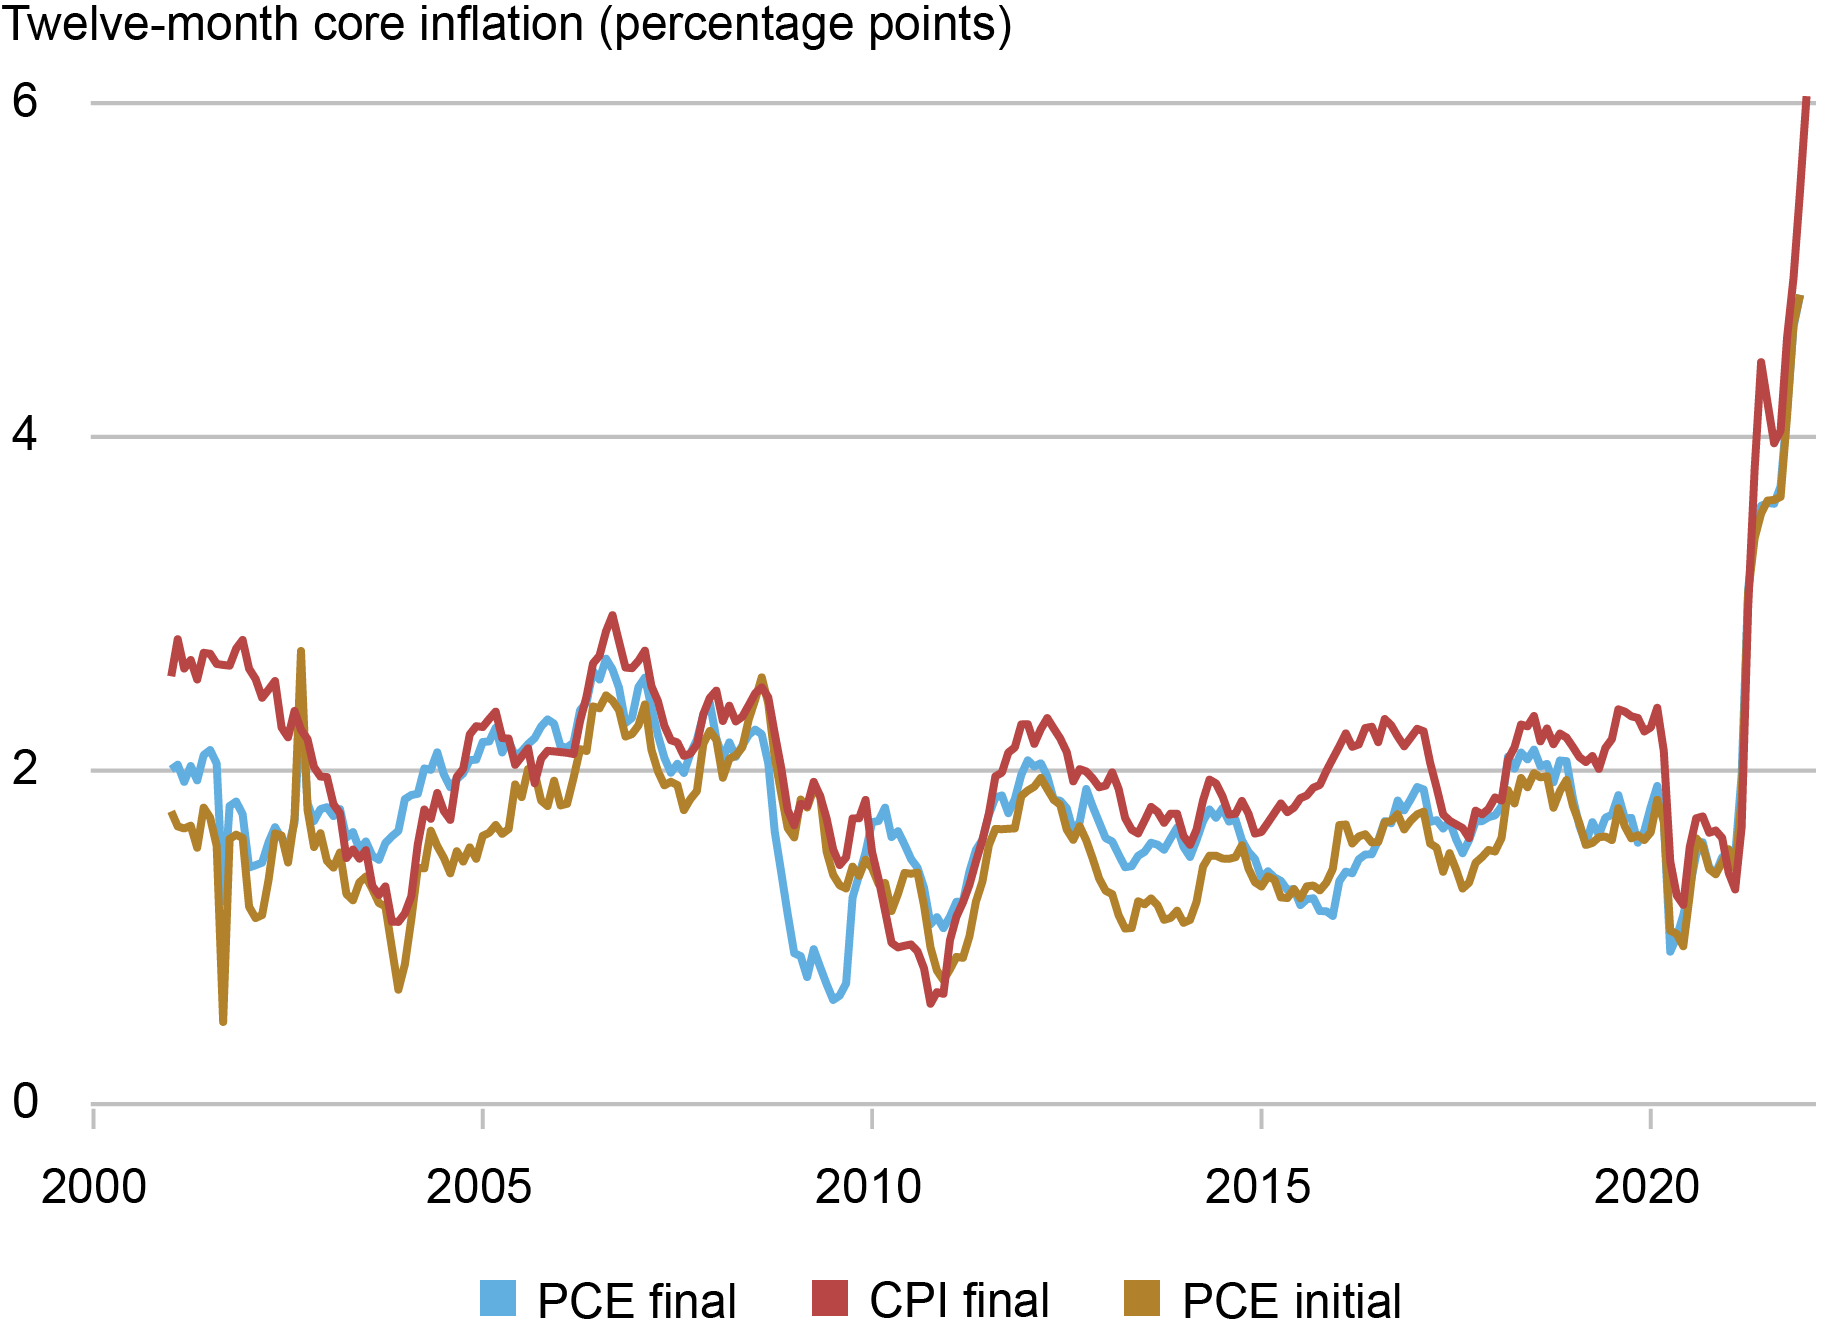
Our next chart shows that the final vintage of core PCE inflation can diverge markedly from the level of inflation implied by the initial one. We plot the year-over-year core PCE inflation rate at the time of the release against the current version of the series. Between 2004 and 2007, for example, the gap between these two series was about 0.4 percentage point. An even larger gap of about 1 percentage point opened late in 2008 and early in 2009 during the Great Recession. In fact, the initial estimates completely missed the large drop in inflation at that time. Toward the end of the sample period, the two series track one another more closely. This is likely because most revisions are yet to take place for the most recent period.
Core PCE Inflation’s Final Estimate Can Differ Substantially from the Initial One
What Drives Revisions in the Core PCE Price Index?
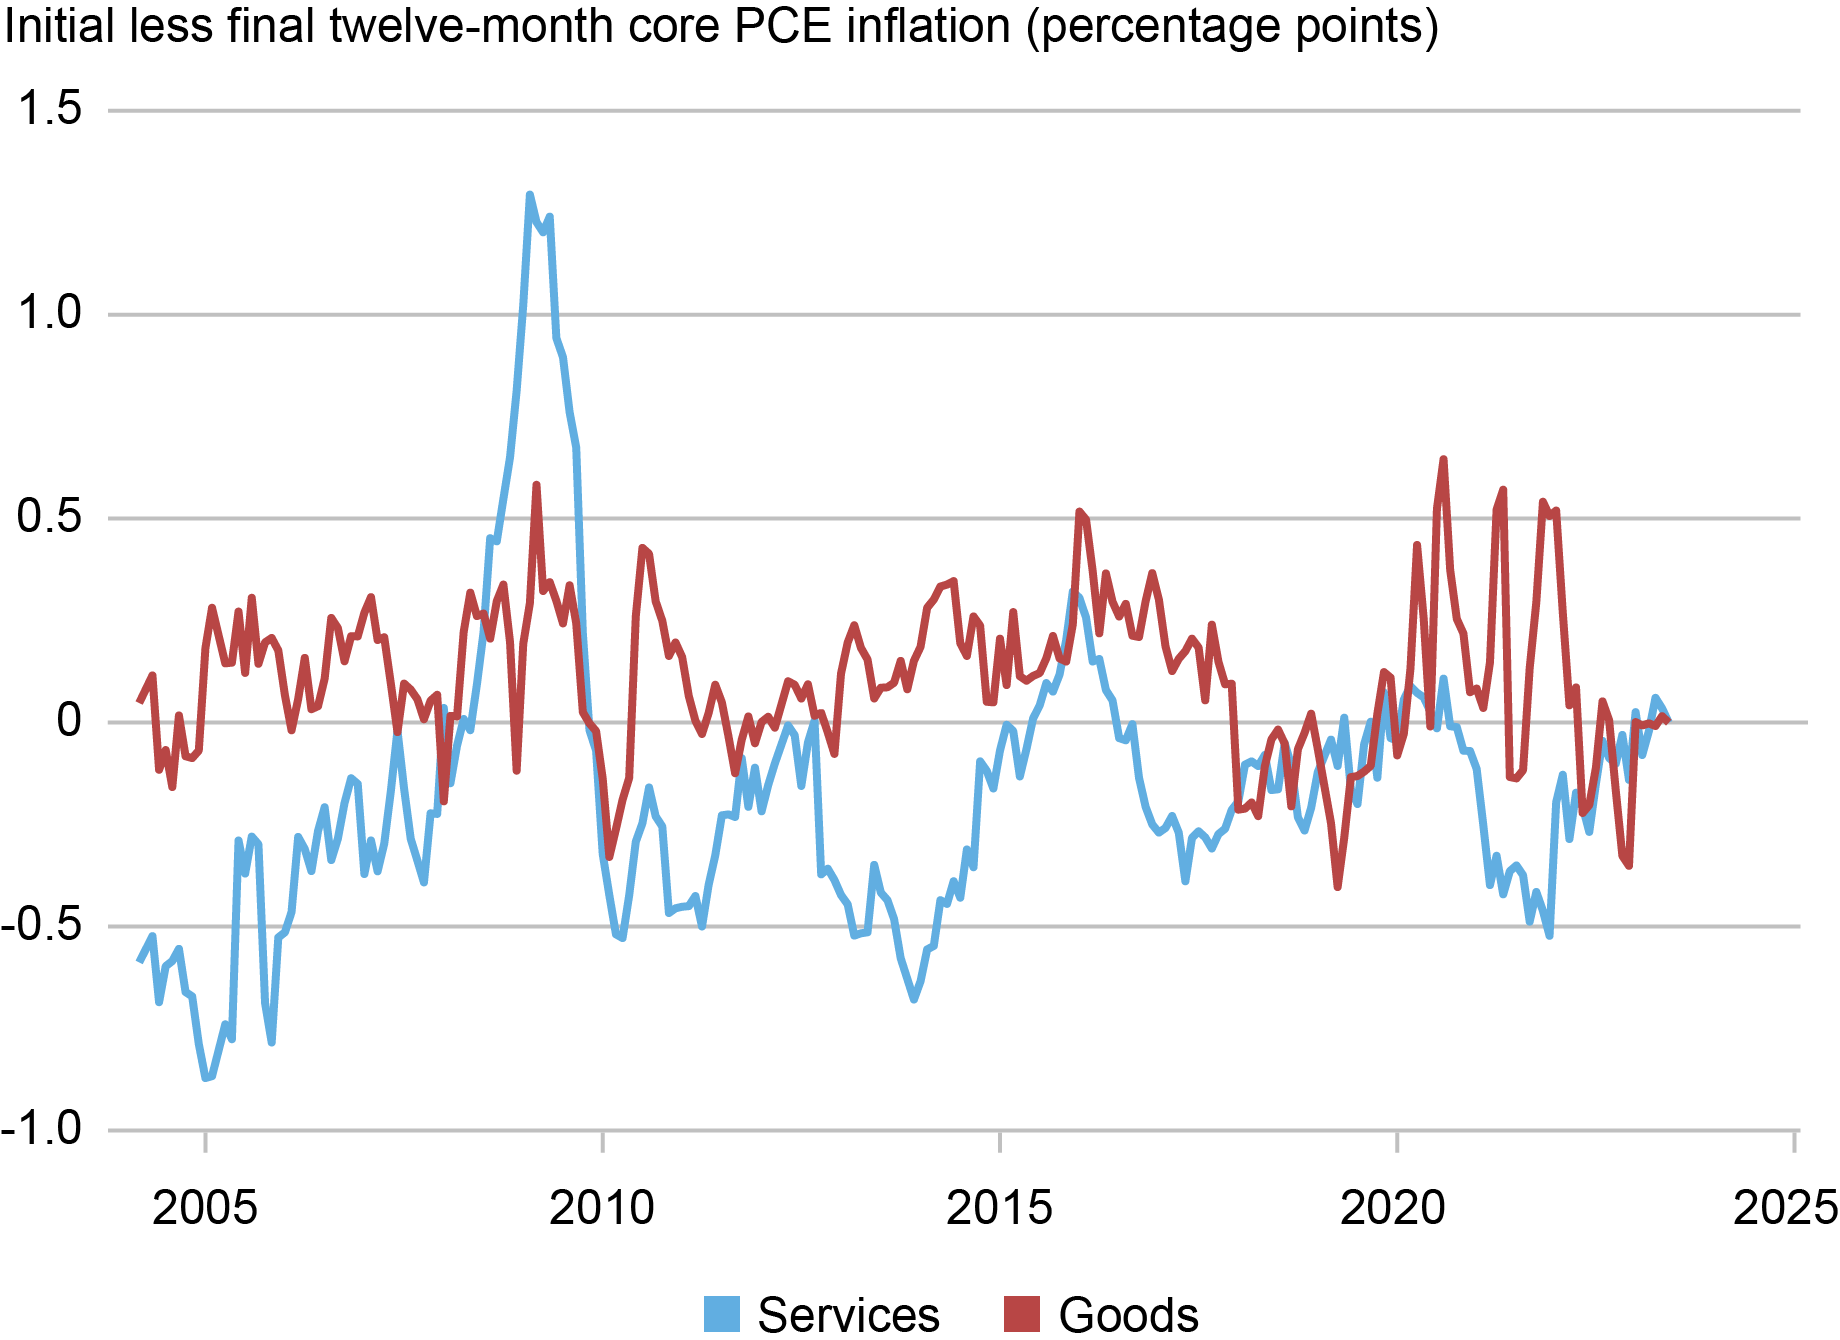
Are revisions larger and more common for some subcomponents of the index? In the chart below, we show the difference between the initial and latest release of year-over-year inflation in core goods (goods inflation excluding food and energy) and core services (services inflation excluding energy services). We can see that both core goods and core services inflation are revised meaningfully although the magnitude of the revisions are generally larger and more persistent for core services. In fact, on average over our sample, the magnitude of revisions to core services is about double that of core goods.
Revisions in Core Services Inflation Are Generally Larger than for Core Goods Inflation
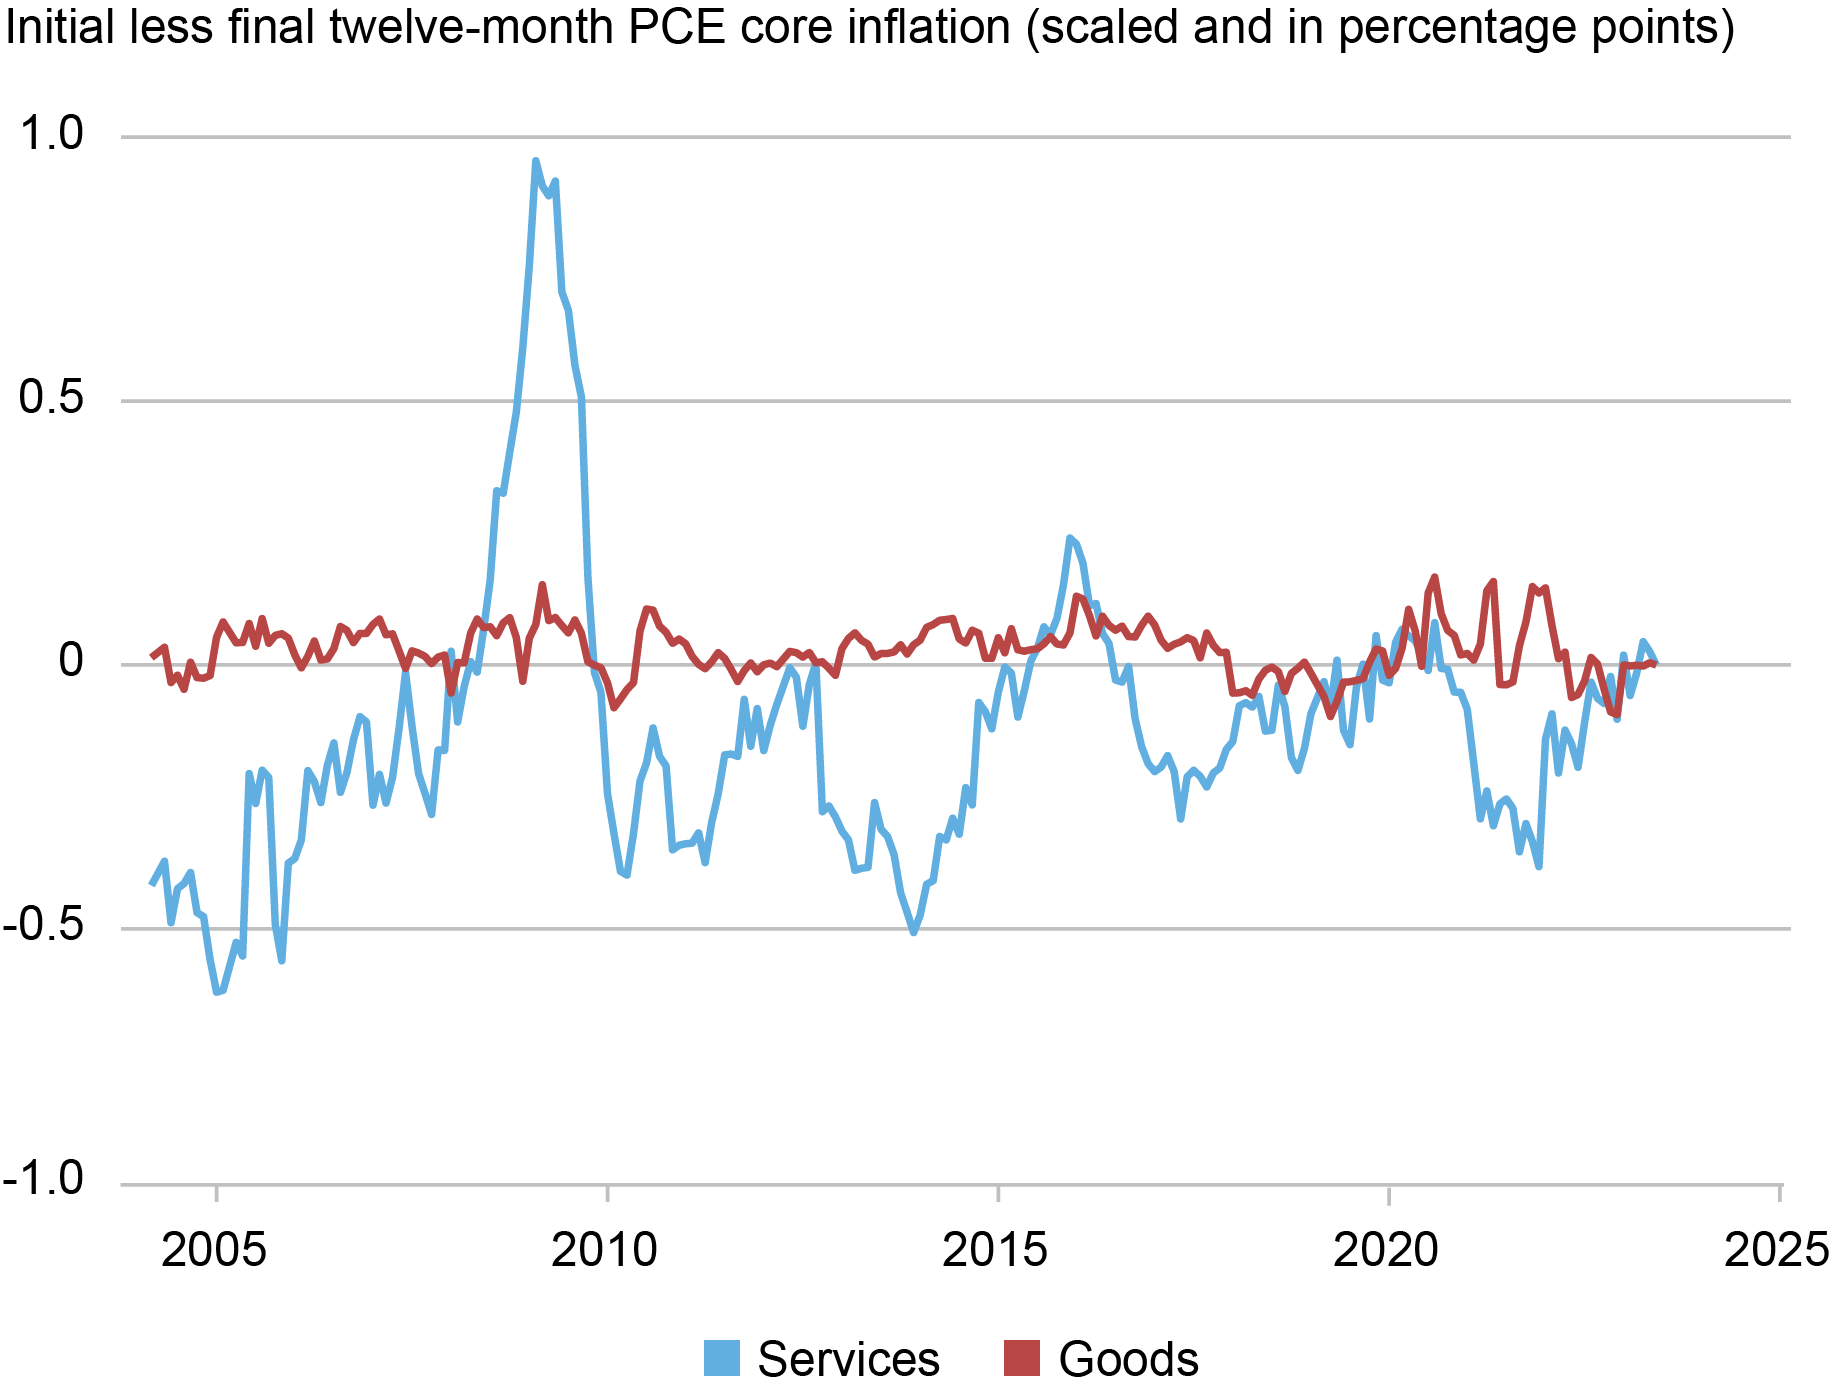
The impact of revisions to these subcomponents onto revisions to core inflation are governed by the share of expenditures in these two subcategories. Over the last twenty years or so, the share of core services expenditures relative to core expenditures (all expenditures less expenditures on food and energy) is about 75 percent. Consequently, the dominant source of revisions to core inflation emerges from revisions to core services inflation. In the next chart we rescale the revisions of these two subcomponents based on their contribution to core inflation. Once they have been rescaled, we observe that almost all the revisions to core inflation originate from core services inflation.
Revisions in Core Services Are the Lion’s Share of Revisions to Core Inflation
The PCE Price Index and the CPI
The consumer price index, the other key measure of inflation in the United States, is also revised on a yearly basis. These revisions tend to be smaller than for the PCE price index, since revisions in the CPI come entirely from updates in the seasonal adjustment factors. As can be seen in the chart below, revisions to monthly CPI inflation have a mass point at zero and they are almost never greater than 1 percentage point in annualized terms.
Core CPI Revisions Are Smaller than Core PCE Revisions
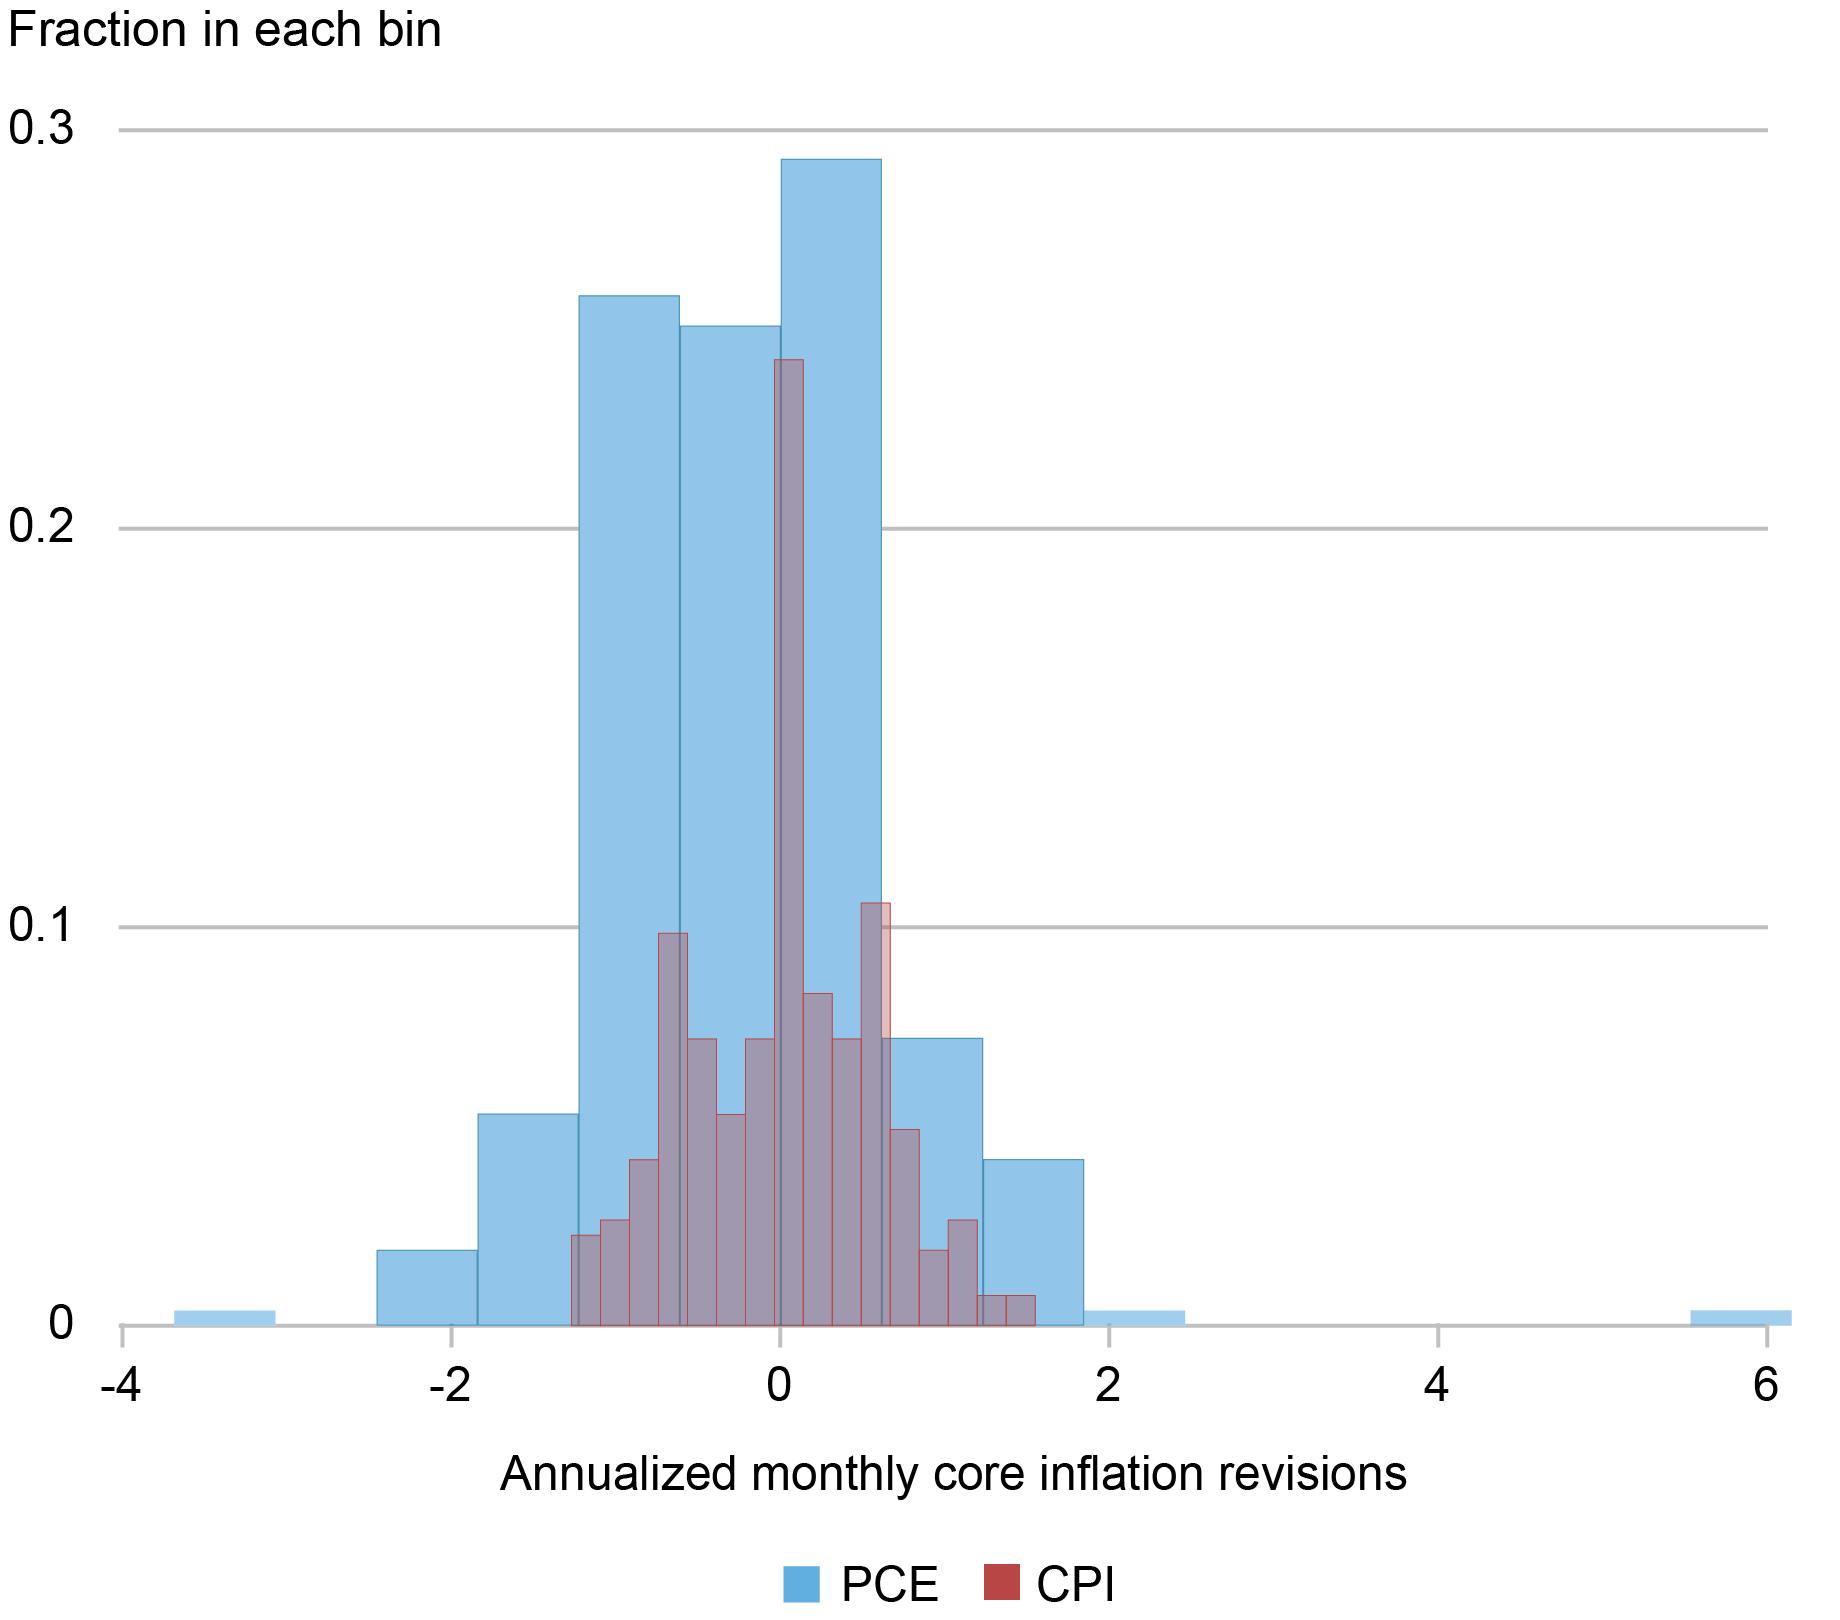
Notes: The vertical axis is the fraction of inflation revisions falling in each bin. For example, 25 percent of inflation rates were revised down between 0 and 0.6 percentage points.
Importantly, since revisions to CPI inflation arise solely from changes to the seasonal adjustment factors, year-over-year CPI inflation is (essentially) never revised. A natural question is whether the initial or final release of PCE inflation is closer to CPI inflation. The chart below shows that no clear pattern stands out. There are periods when revisions in PCE inflation make the final series closer to CPI inflation, such as over the periods 2005-07 and 2013-15. There are also periods when revisions in PCE inflation cause it to diverge from CPI inflation, as was the case during the Great Recession.
Core CPI Inflation Is Not a Consistent Signal of the Directions of Revisions to Core PCE Inflation
Conclusion
We have shown that differences between PCE inflation for all vintages and CPI inflation can be substantial. For example, over the period from 2001-18 the differences between year-over-year core PCE inflation based on the initial release versus the final series were large. The gap ranged from -1 to 1.6 percentage point and 90 percent of the time was between -0.5 and 0.5 percentage point. Taken plainly, these gaps would suggest a plausible range for the current year-over-year core PCE inflation rate of as high as about 4.7 percent and as low as around 3.7 percent. Our results show the significant uncertainty surrounding the measurement of inflation in real time, which adds to the challenges faced by policymakers, analysts and the general public in analyzing inflation.


Richard Audoly is a research economist in Labor and Product Market Studies in the Federal Reserve Bank of New York’s Research and Statistics Group.

Martín Almuzara is a research economist in Macroeconomic and Monetary Studies in the Federal Reserve Bank of New York’s Research and Statistics Group.

Richard K. Crump is a financial research advisor in Macrofinance Studies in the Federal Reserve Bank of New York’s Research and Statistics Group.

Davide Melcangi is a research economist in Labor and Product Market Studies in the Federal Reserve Bank of New York’s Research and Statistics Group.

Roshie Xing is a research analyst in the Federal Reserve Bank of New York’s Research and Statistics Group.
How to cite this post:
Richard Audoly, Martín Almuzara, Richard Crump, Davide Melcangi, and Roshie Xing, “How Large Are Inflation Revisions? The Difficulty of Monitoring Prices in Real Time,” Federal Reserve Bank of New York Liberty Street Economics, September 7, 2023, https://libertystreeteconomics.newyorkfed.org/2023/09/how-large-are-inflation-revisions-the-difficulty-of-monitoring-prices-in-real-time/
BibTeX: View |


Disclaimer
The views expressed in this post are those of the author(s) and do not necessarily reflect the position of the Federal Reserve Bank of New York or the Federal Reserve System. Any errors or omissions are the responsibility of the author(s).
 RSS Feed
 Follow Liberty Street Economics