


“Nowcasts” of GDP growth are designed to track the economy in real time by incorporating information from an array of indicators as they are released. In April 2016, the New York Fed’s Research Group launched the New York Fed Staff Nowcast, a dynamic factor model that generated estimates of current quarter GDP growth at a weekly frequency. The onset of the COVID-19 pandemic sparked widespread economic disruptions—and unprecedented fluctuations in the economic data that flow into the Staff Nowcast. This posed significant challenges to the model, leading to the suspension of publication in September 2021. Taking advantage of recent developments in time-series econometrics, we have since developed a more robust version of the Staff Nowcast model, one that better handles data volatility. In this post, we discuss the model’s new features, present estimates of current quarter GDP growth, and evaluate how the Staff Nowcast would have performed during the pandemic period. Today’s post marks the resumption of regular New York Fed Staff Nowcast releases, to be published each Friday.
What’s New in the Model?
A dynamic factor model postulates that a certain number of observed variables are driven by a small number of dynamic unobserved (latent) factors, while features specific to each series are captured by idiosyncratic errors. The model processes incoming data releases, recording as “news” any discrepancies between the input series and the model’s prediction for that data release. This “news”, in turn, impacts the model’s GDP growth estimate according to the weight that it attributes to the new information. Building on this basic structure, the new model specification includes several features that better enable it to handle highly volatile data like those observed during the pandemic. We sketch these features below (see this paper for a more extensive discussion).
First, we have introduced stochastic volatility and outlier adjustment to the latent variable dynamics. Furthermore, relative to the legacy model, we let the lags of one factor affect the current value of another factor, which allows the model to capture more general lead-lag relationships between variable subgroups. The nonlinear dynamics in the factor update equations reduce the model’s sensitivity to large shocks, ensuring that the model can handle smaller surprises as normal without overreacting to the drastic deviations observed during the COVID-19 pandemic. The addition of these richer dynamics in the latent variables improves the model’s forecasting performance.
We also modified the specification of the loading structure. As in the legacy model, every series loads on a single “global” factor, while specific subgroups of series load on additional factors. Specifically, we include a “soft” factor to capture local correlations in survey data and a “labor” factor for series pertaining to labor market variables, as in the legacy model. For the new specification, we replace the “real” factor with a “nominal” factor, onto which load series that measure price levels or enter the model in nominal terms. Importantly, we include a fifth “COVID” factor, only active from March to September of 2020, to capture correlated variation in several series that were affected by the pandemic. This latent factor structure allows the model to better handle the kinds of extreme data releases seen during the pandemic, a case study discussed at the end of this post.
Finally, we use a Bayesian estimation approach, which enables us to report probability intervals alongside each point estimate of real GDP growth.
How to Read the Model’s Output
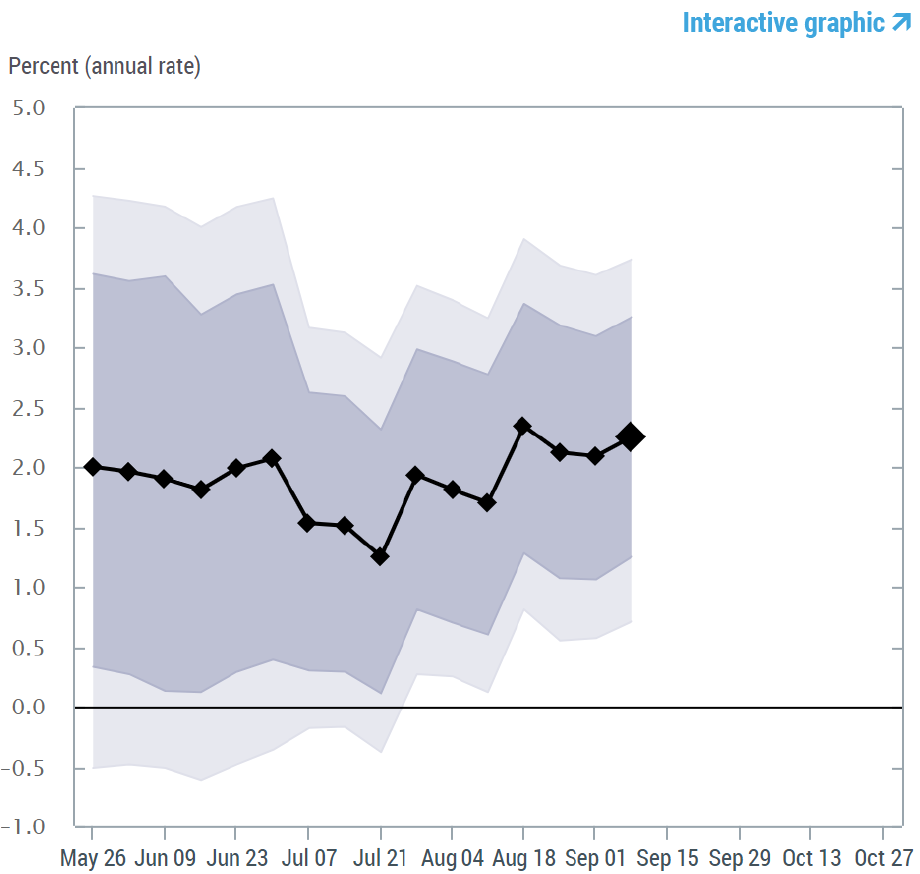
The visualization of the real-time evolution of our GDP growth estimate in a particular quarter is similar to the one we had for the legacy model, but is displayed in two charts, as presented below for 2023:Q3. The charts will be updated weekly until the advance estimate of GDP for Q3 is released on October 26, after which we will only issue updated estimates for growth in the following quarter. In the first chart, the black line represents the evolution of the Staff Nowcast, with the diamonds indicating the point estimate at each update, based on information available at that time. This chart also includes probability bands that measure the uncertainty of the estimate and are designed to contain the observed value for GDP growth with 50 percent and 68 percent probability.
New York Fed Staff Nowcast, September 8, 2023
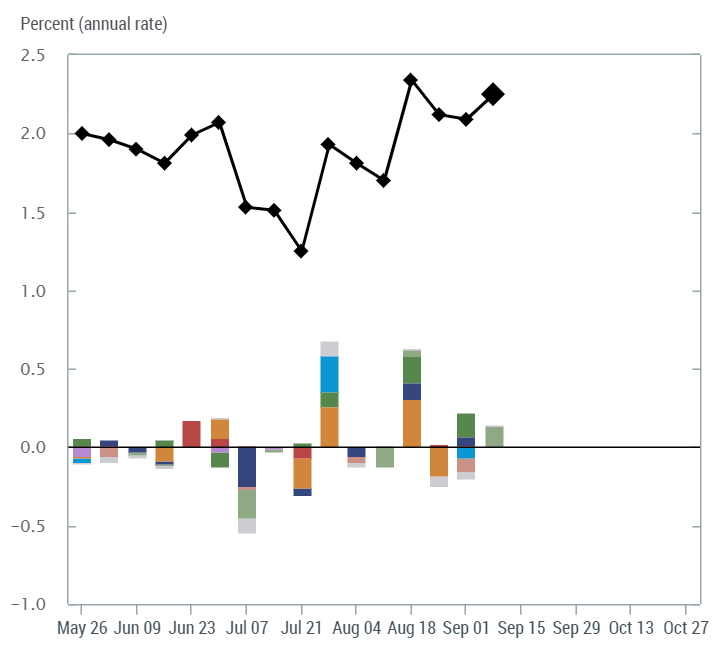
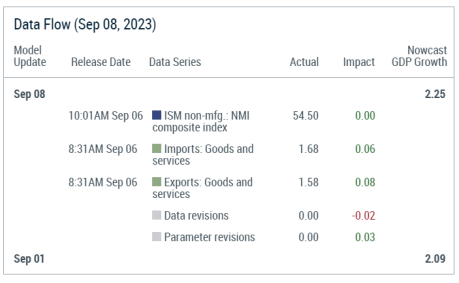
The second chart represents the contribution of each piece of “news” to the change in the Staff Nowcast for the week. Recall that “news” is the difference between each data release throughout the week and the model prediction for that release. This “news” is translated into an impact on the GDP growth estimate based on a “weight” that represents the relevance of that variable for the GDP nowcast. We aggregate news by color-coded categories, as displayed in the key. The sum of the impacts of the week’s news on the Staff Nowcast, represented by the colored bars for each category, is the total change in the GDP growth estimate for that week. The accompanying table provides further details. For example, in the update on Friday, July 7, 2023, the Staff Nowcast decreased by 0.6 percentage point relative to the previous week due to negative surprises in manufacturing survey data and international trade data.
New York Fed Staff Nowcast, September 8, 2023:
Impact of Data Releases

The New York Fed Staff Nowcast over the Pandemic Period
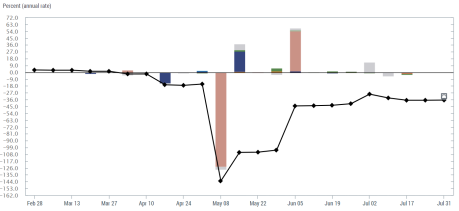
Have we built enough flexibility into the New York Fed Staff Nowcast model to provide early signals of economic contractions, even when these happen suddenly? The COVID-19 recession was such an event: brief, defined by the NBER as lasting just two months (with the peak in February 2020 and the trough in April), yet with a broad and deep impact on the economy. Although at the onset of the pandemic we didn’t have the model in the current form, we have reconstructed a weekly, real-time evolution of the New York Fed Staff Nowcast for 2020:Q2 and 202:Q3, by updating the estimates each week based on the data available at that time. This allows us to follow the model performance over the sudden recession and recovery episodes.
The chart below shows the evolution of the Staff Nowcast for 2020:Q2. The first indication of a recession occurred when the Staff Nowcast incorporated the beginning-of-the-quarter parameter estimates on April 1. This estimation introduced the COVID factor, which is only active from March through September 2020. The first significant decline came with large negative surprises in manufacturing survey data in late April, followed by a nosedive in the Staff Nowcast in early May, when April labor market figures were released. The magnitude of the month-over-month drop in employment data (payroll employment data from BLS dropped by 20.2 million and unemployment jumped to 10.3 percent) far exceed the model’s forecasts, resulting in a drop to -143.1 percent. Some recovery in the Staff Nowcast occurred when the Empire State Manufacturing Survey came out above expectations, and again when the model processed positive surprises in the May labor market data. The Staff Nowcast remained relatively stable for the remainder of the period, reaching a final estimate of -36.6 percent. For reference, the advance estimate of GDP growth for the second quarter, released by the BEA on July 30, 2020, was -32.9, percent, which was revised up to -31.4 percent in the third estimate, released on September 30, 2020.
New York Fed Staff Nowcast for 2020:Q2
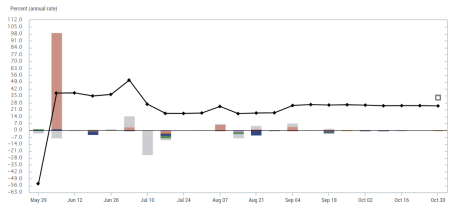
After the dramatic drop in the second quarter, GDP growth rebounded in the third quarter. The Staff Nowcast for 2020:Q3 tracks this rebound, recording an early jump from the initial estimate of -54.1 percent to +38 percent with the release of the May labor market data. The estimate reaches a high of +51.0 percent on July 2 after a positive surprise in private payroll employment, but this is tempered to +27.0 percent after the July parameter re-estimation and downward revisions as negative surprises from retail sales, manufacturing surveys, and industrial production are incorporated. Fluctuations are small over the subsequent weeks and the final estimate is 24.9 percent for the quarter. The advance estimate of GDP growth for Q3, released on October 29, 2020, was +33.1 percent, revised only marginally (to +33.4 percent) in the third estimate, released on December 22, 2020.
New York Fed Staff Nowcast for 2020:Q3
Overall, the model captures the dramatic, sudden drop in economic activity in March-April 2020. The model’s ability to effectively process large data surprises—both negative and positive—over the pandemic period showcases its flexibility. Despite large swings in the Staff Nowcast point estimates during 2020 Q2, the probability intervals (not shown in the chart) remain relatively tight. The 50 percent and 68 percent bands span 2.0 and 2.9 points, respectively, at the beginning of the quarter, with the interval growing to approximately 4.5 and 6.5 points wide after the parameters are re-estimated in April. The probability intervals shrink to a width of 2.0 and 2.8 points by the end of the quarter. 2020 Q3 has wider confidence intervals over the period compared to Q2, reflecting the period’s even greater uncertainty. The 50 percent and 68 percent bands drop to a width of 1.8 and 2.7 points by the end of the quarter.

Martín Almuzara is a research economist in Macroeconomic and Monetary Studies in the Federal Reserve Bank of New York’s Research and Statistics Group.
Katie Baker is a former research analyst in the Federal Reserve Bank of New York’s Research and Statistics Group.

Hannah O’Keeffe is a research analyst in the Federal Reserve Bank of New York’s Research and Statistics Group.

Argia Sbordone is the head of Macroeconomic and Monetary Studies in the Federal Reserve Bank of New York’s Research and Statistics Group.
How to cite this post:
Martin Almuzara, Katie Baker, Hannah O’Keeffe, and Argia Sbordone, “Reintroducing the New York Fed Staff Nowcast,” Federal Reserve Bank of New York Liberty Street Economics, September 8, 2023, https://libertystreeteconomics.newyorkfed.org/2023/09/reintroducing-the-new-york-fed-staff-nowcast/
BibTeX: View |

Disclaimer
The views expressed in this post are those of the author(s) and do not necessarily reflect the position of the Federal Reserve Bank of New York or the Federal Reserve System. Any errors or omissions are the responsibility of the author(s).
 RSS Feed
 Follow Liberty Street Economics