


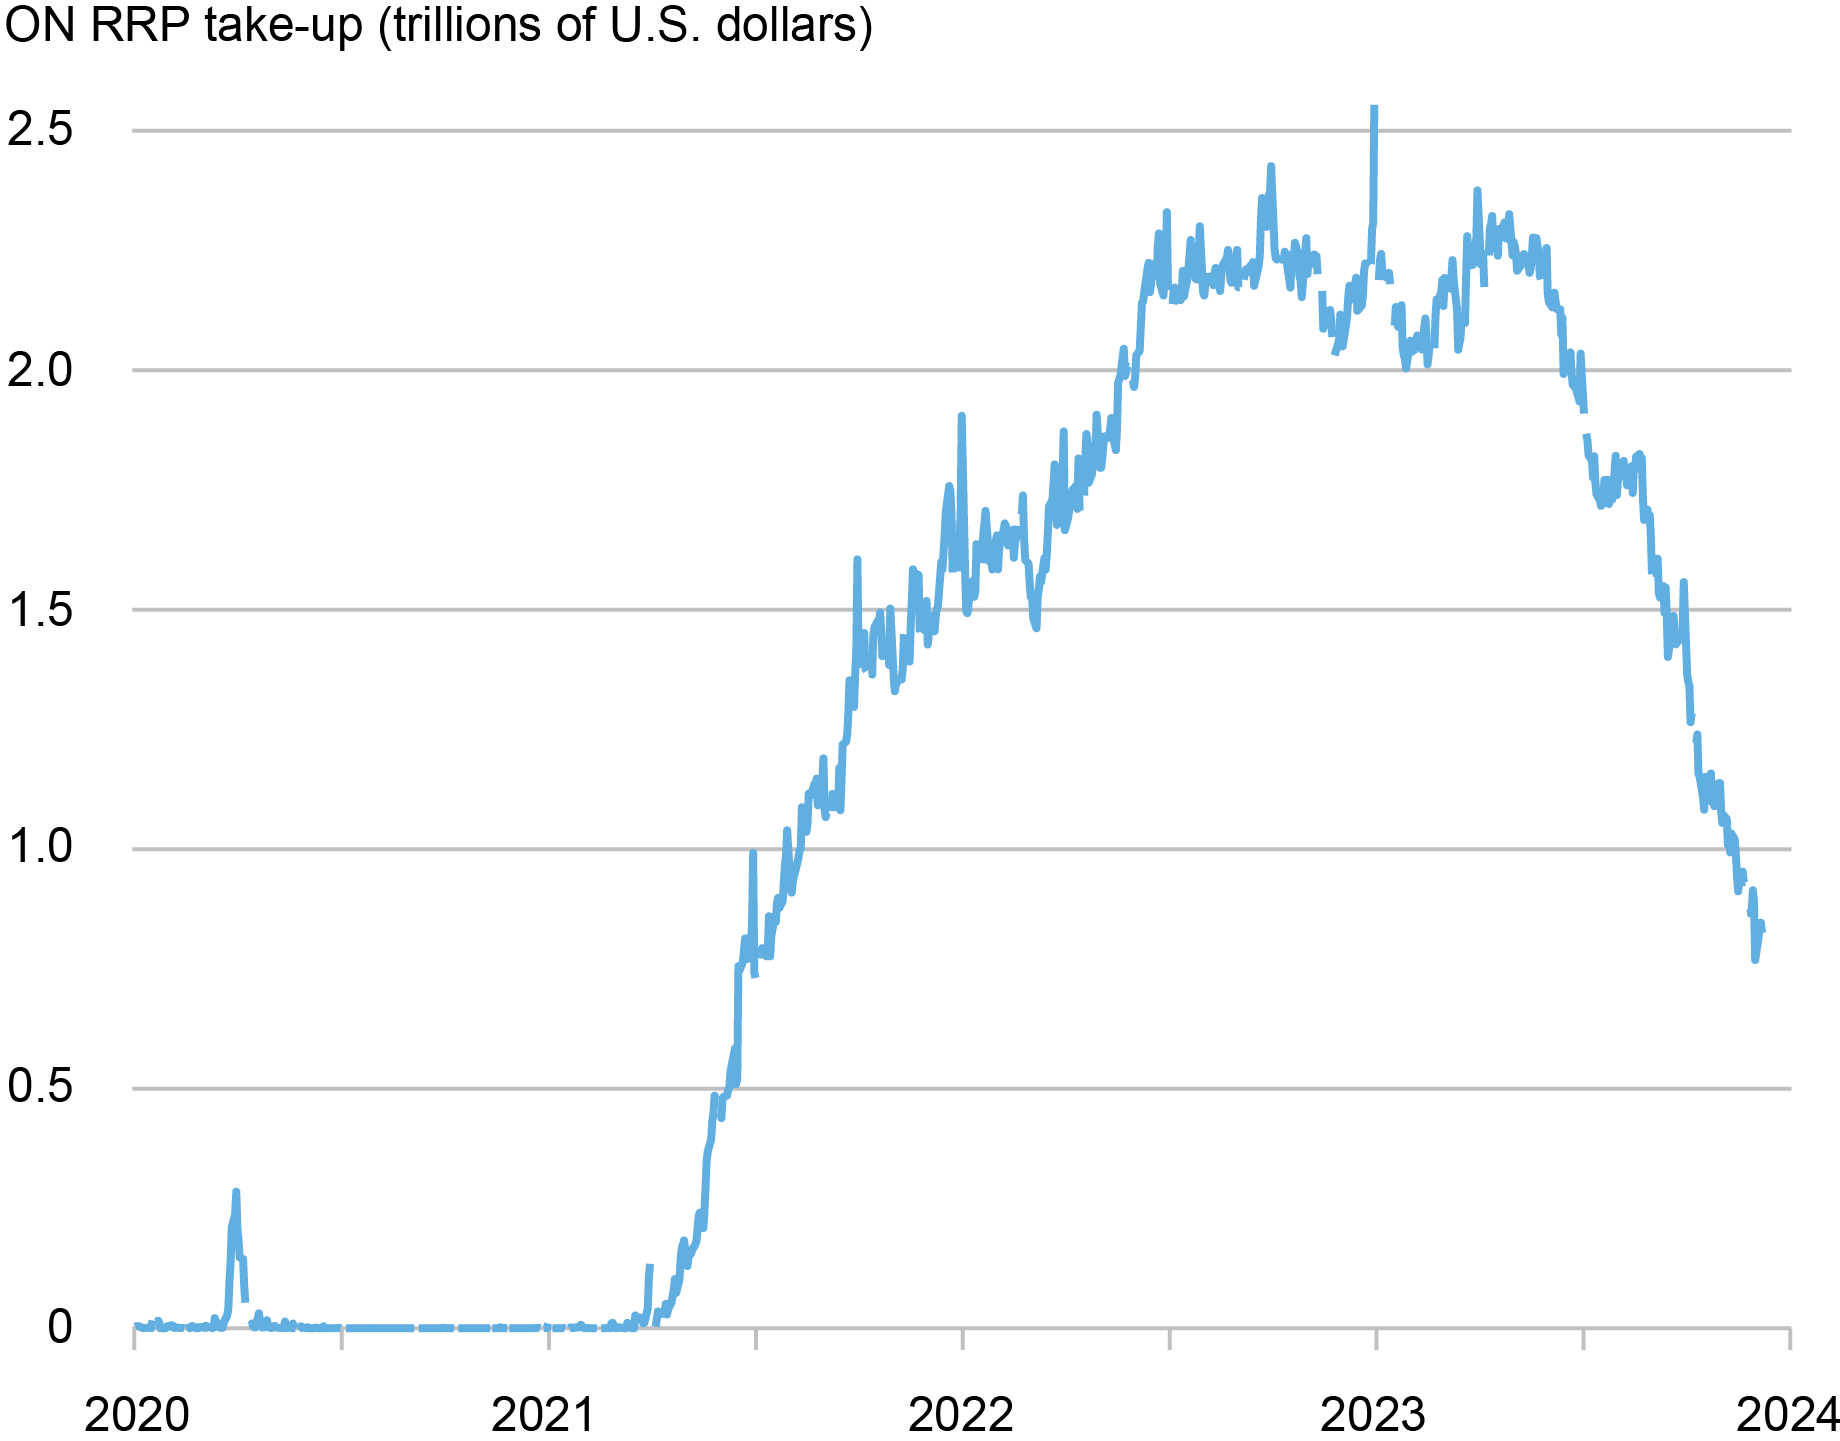
Take-up at the Overnight Reverse Repo Facility (ON RRP) has halved over the past six months, declining by more than $1 trillion since June 2023. This steady decrease follows a rapid increase from close to zero in early 2021 to $2.2 trillion in December 2022, and a period of relatively stable balances during the first half of 2023. In this post, we interpret the recent drop in ON RRP take-up through the lens of the channels that we identify in our recent Staff Report as driving its initial increase.
ON RRP Take-up Has Been Decreasing since June 2023…
Banks’ Balance-Sheet Costs
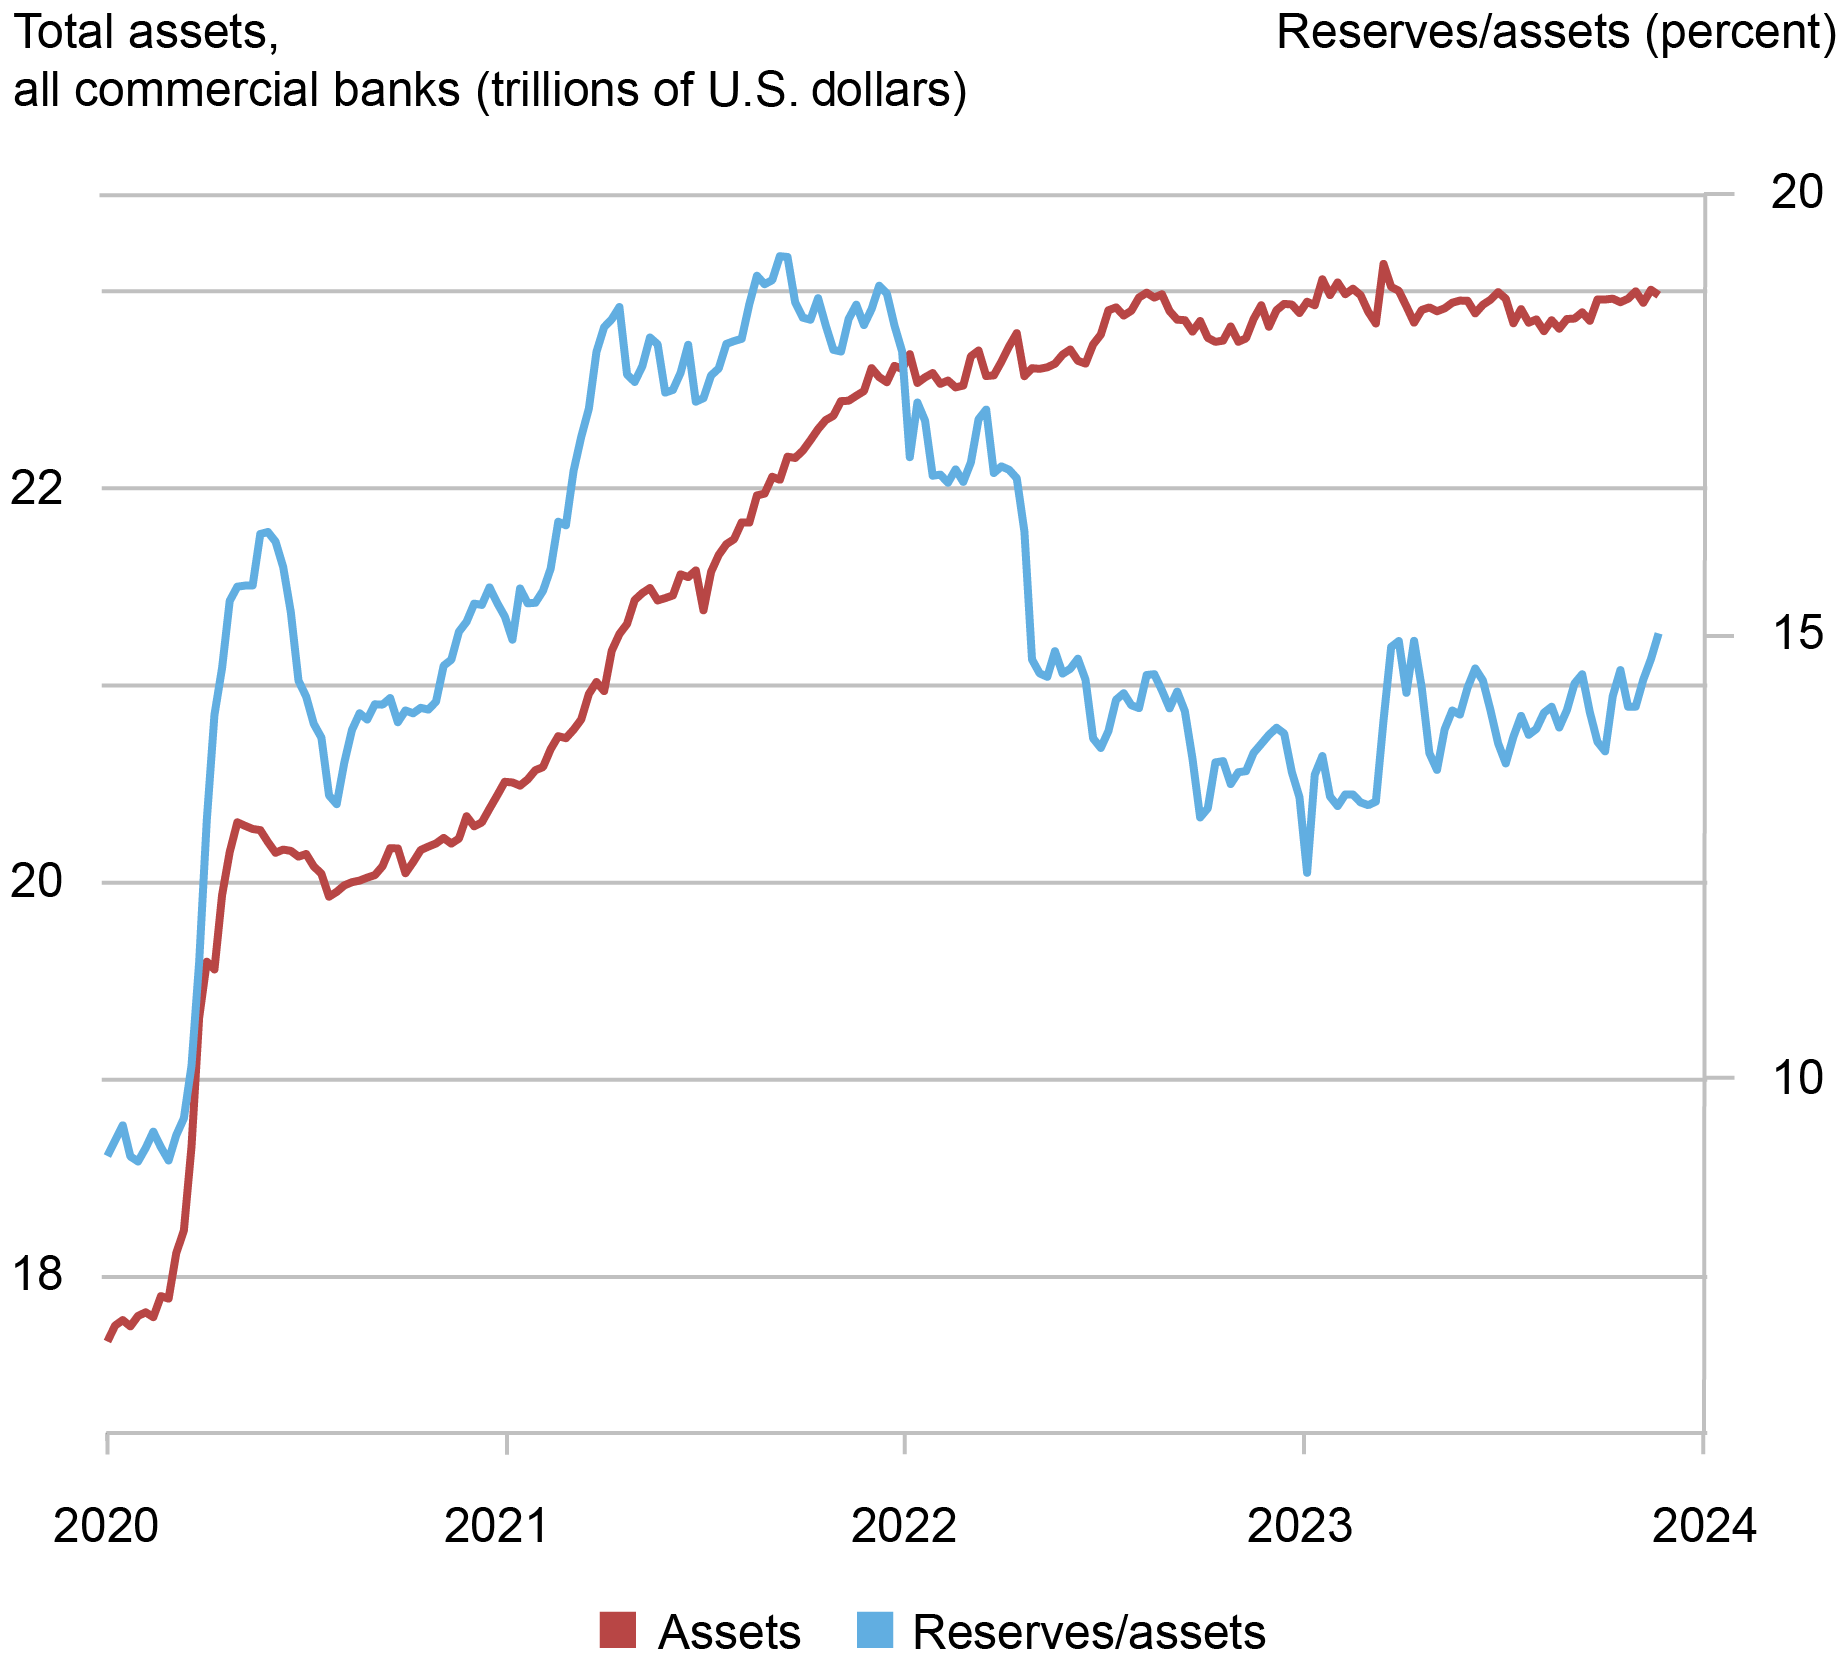
As the Federal Reserve expanded its balance sheet in response to the COVID-19 pandemic, it increased the supply of reserves to the banking system and, as a result, banks’ balance sheets also grew. Reserves increased from $1.6 trillion—or 9 percent of banks assets—in January 2020 to $3.2 trillion—or 16 percent of bank assets—over the following three months, reaching a historical maximum of 19 percent of banks’ assets in September 2021. As the chart below shows, bank assets also grew from $18 trillion in January of 2020 to $20 trillion in April 2020, and continued to increase to $23 trillion in May 2023.
As banks’ balance sheets expand, regulatory ratios—such as the supplementary leverage ratio (SLR)—are likely to become tighter for some institutions. Banks react to increased balance-sheet costs by pushing some of their deposits toward the money market fund (MMF) industry—for instance, by lowering the rate paid on bank deposits—and reducing their demand for short-term debt. As we explain in our paper, both effects are likely to have boosted ON RRP take-up during March 2021 – May 2023, as most MMFs are eligible to invest in the ON RRP and do so especially when alternative investment options, such as banks’ wholesale short-term debt—including repos by dealers affiliated with a bank holding company—dwindle.
Likely, these effects have subsided relative to 2022. Indeed, since June 2023, bank assets have hovered around $23 trillion, slightly below their March 2023 peak. Moreover, reserves have been around 14 percent of bank assets since June 2023, below the average of 16 percent observed between March 2020 and May 2023. Since the SLR treats all assets in the same way regardless of their riskiness, large banks’ balance-sheet expansions are particularly costly if they are used to finance safe assets with low returns. Therefore, though bank assets have remained relatively stable, the recent decline in the ratio of reserves to bank assets has likely reduced banks’ overall balance-sheet costs.
…while Bank Assets and Reserves Relative to Bank Assets Have Remained Roughly Constant.
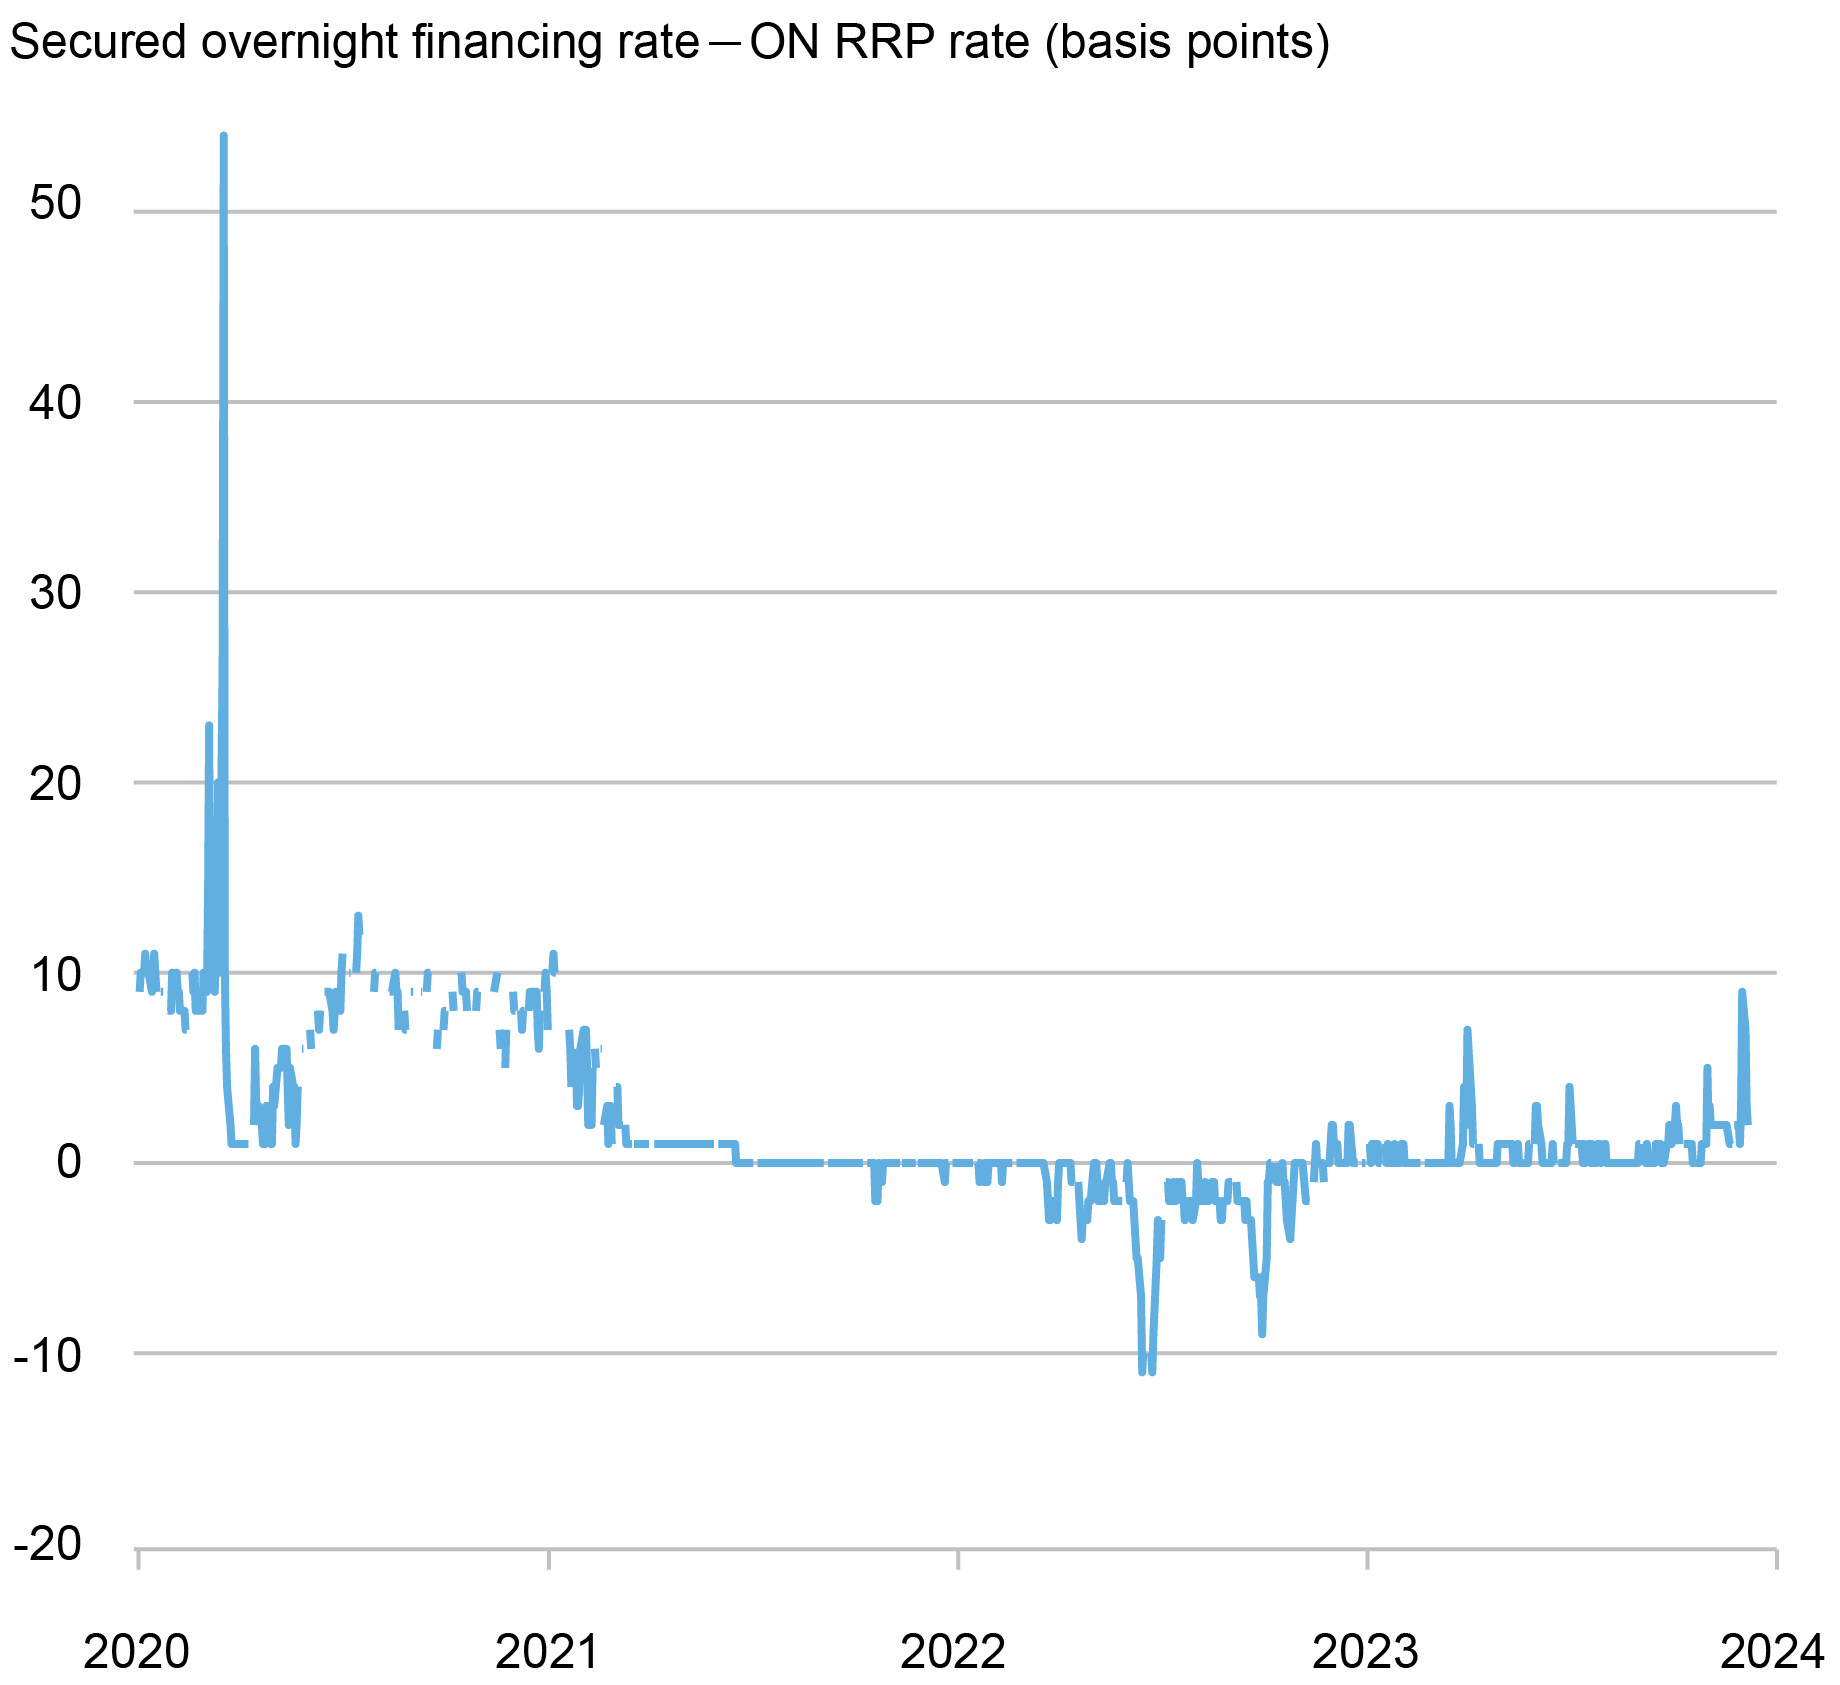
Consistent with a decrease in banks’ balance-sheet costs (and an increase in the supply of bank debt), the interest rates at which banks and broker dealers borrow via overnight Treasury-backed repos have increased since the fourth quarter of 2022 and are now a few basis points above the ON RRP rate (see chart below). This positive rate differential pushes MMFs away from investing at the ON RRP facility and into private repos.
The SOFR-ON RRP Spread Has Been Positive…
Monetary Policy
Monetary policy can affect ON RRP take-up by MMFs in two ways. First, the interest-rate pass-through of MMF shares is higher than that of bank deposits; as a result, the size of the MMF industry comoves with the monetary policy cycle as investors switch from bank deposits to MMF shares when the policy rate increases. Though the assets of the MMF industry are at an all-time high, the pace of the increase has somewhat decreased recently, consistent with a slower pace of monetary policy tightening; moreover, the share of MMF assets managed by government funds—the ones most likely to invest in the ON RRP—has decreased since June 2022 by 7 percentage points.
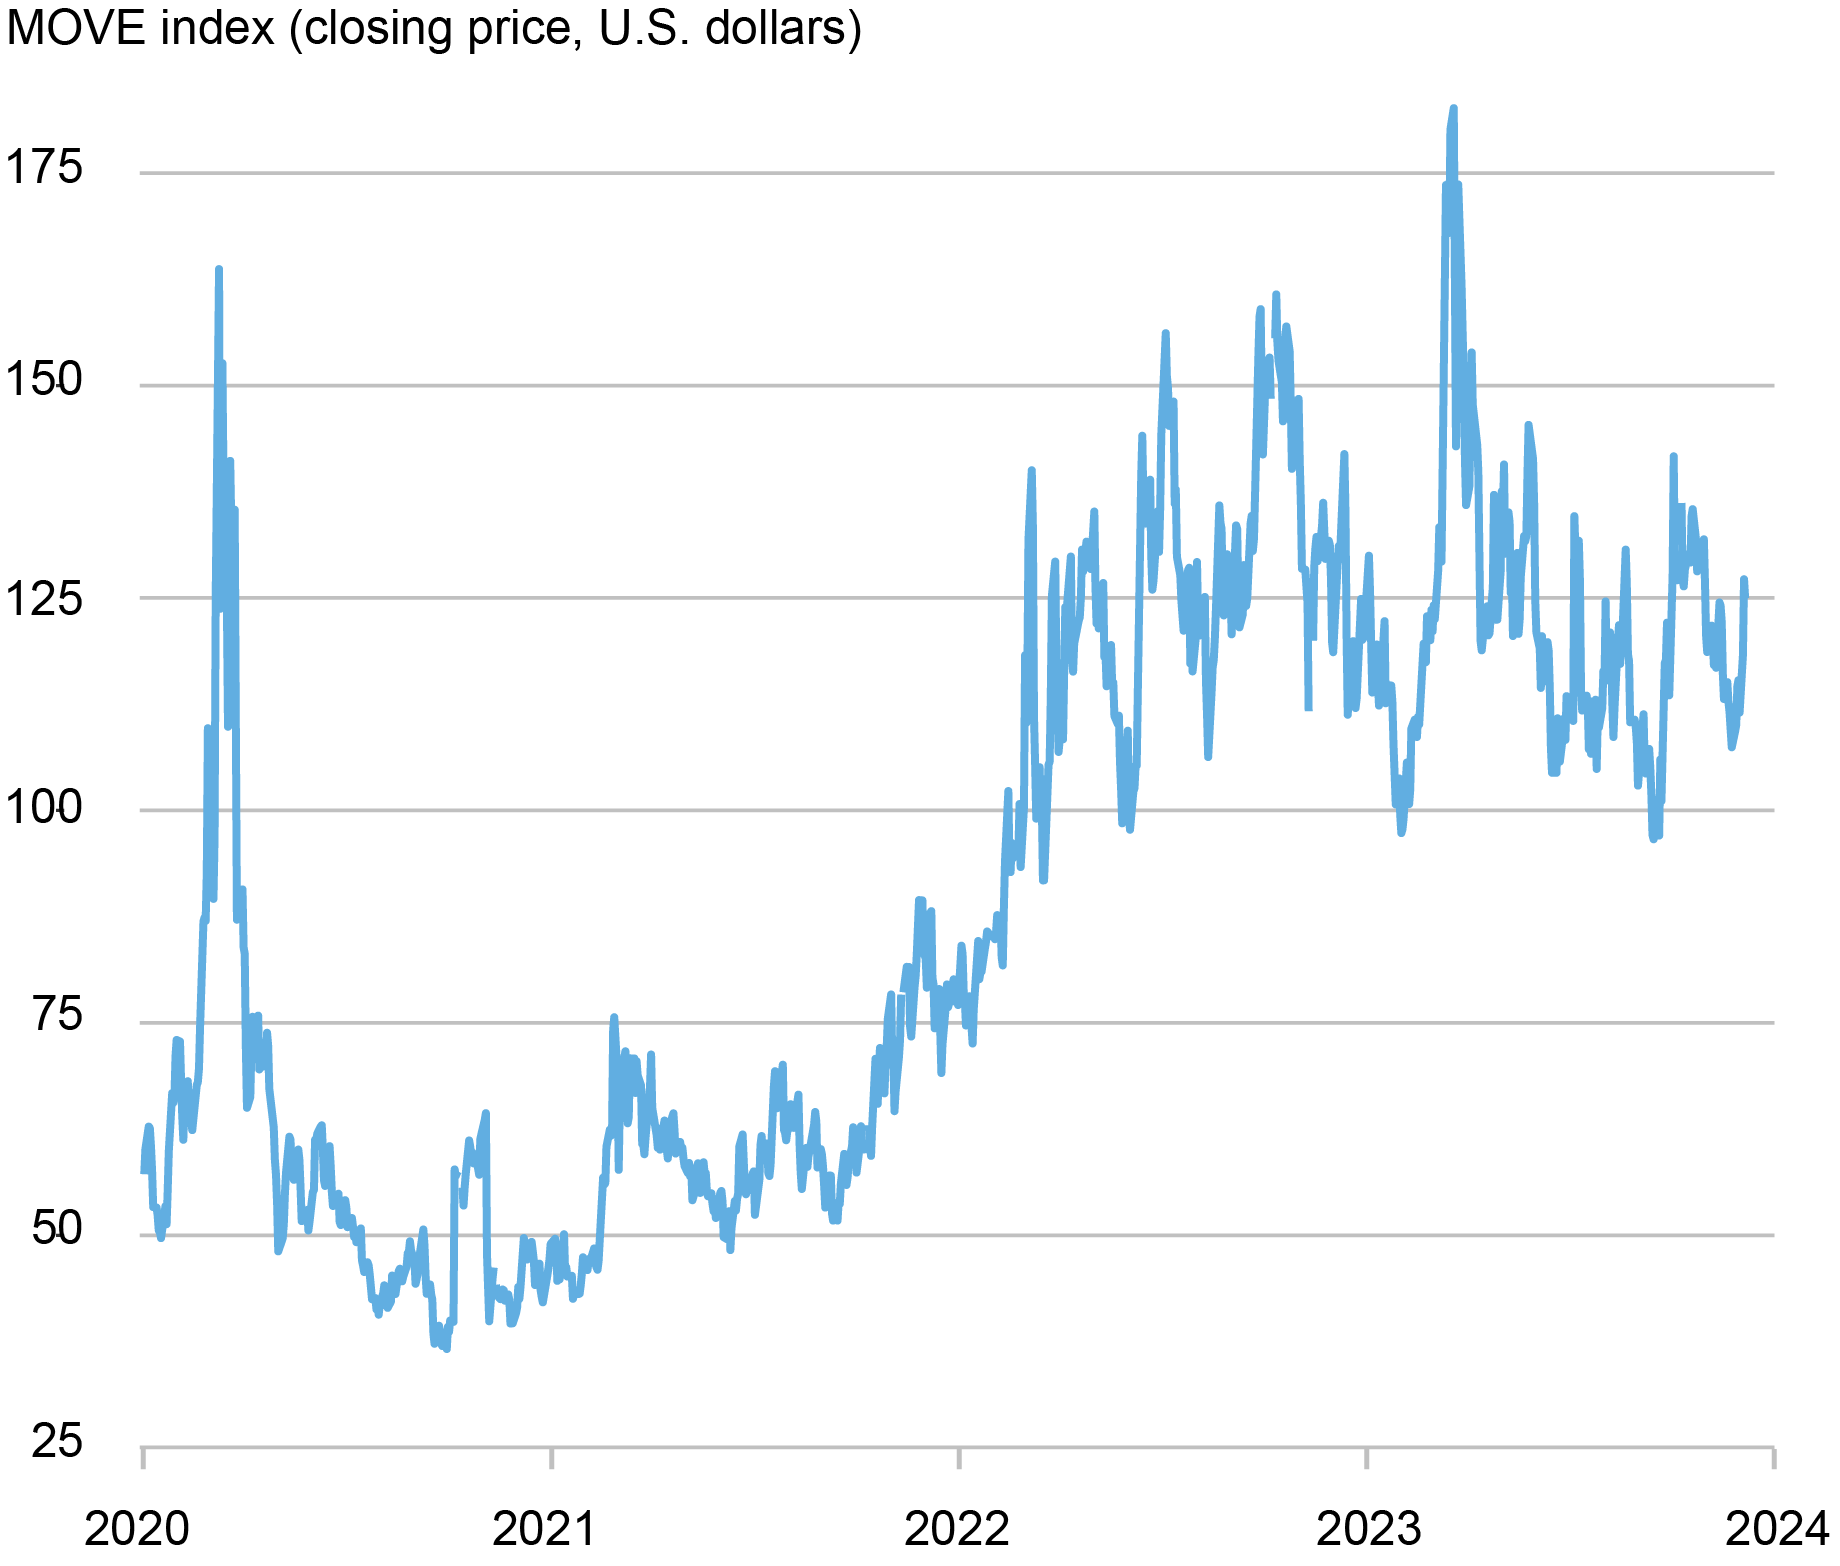
Second, monetary policy can affect MMFs’ take-up at the ON RRP also through its effect on interest-rate uncertainty. Higher uncertainty leads MMFs to rebalance their portfolios toward investments with shorter duration; the ON RRP is one such investment as it is overnight. Indeed, interest rate uncertainty—as measured by the MOVE index—had increased substantially during the latest tightening cycle, raising from 57.3 in May 2021 to 136 in May 2023. Recently, however, the increase has been partially reversed. Indeed, the average level of the MOVE was 125.6 in the first half of 2023 but declined to 117.3 in the second half of the year.
…while Interest-Rate Uncertainty Has Been Decreasing.
The Supply of T-bills
A third driver of ON RRP take-up is the supply of T-bills. The Federal Government has expanded the supply of T-bills dramatically in 2023: T-bills outstanding increased from $3.7 trillion at the end of 2022 to $5.3 trillion at the end of September 2023, with a $1.3 trillion increase since June. As the supply of T-bills grows, the investment options of MMFs—and especially of government funds, which represent 83 percent of the industry and can only invest in short-term government debt and repos backed by government debt—expand and, as a result, their investment in the ON RRP dwindles. In our staff report, we estimate that a $100 billion increase in the amount of T-bill issuance reduces the proportion of ON RRP investment in a government-MMF portfolio by 2.3 percentage points, relative to that in a prime-MMF portfolio; since average monthly T-bill issuance went from $1.12 trillion in the period from 2022:Q1-2023:Q1 to $1.53 trillion in 2023:Q2-2023:Q3, this effect on portfolio rebalancing amounts to an additional decrease in ON RRP investment of roughly $350 billion.
Summing It Up
The increase in ON RRP take-up between 2021 and May 2023 was driven by a series of factors: a rise in banks’ balance-sheet costs due to the expansion of the supply of reserves in response to the COVID-19 pandemic, the rapid hikes in policy rates aimed at fighting inflation and the resulting increase in interest-rate uncertainty, and the decrease in the T-bill supply of 2021-22 resulting from the normalization of public debt after the COVID-19 crisis.
These factors have reversed: the Federal Reserve restarted running off its balance sheet after the temporary expansion during the banking turmoil of March 2023; the growth of the banking system waned while the ratio of reserves to asset decreased; the pace of interest-rate hikes slowed down; and the T-bill supply increased again. If these dynamics persist in the months ahead, ON RRP take-up may continue to decrease. Such a steady decline would be consistent with that observed in early 2018, when investment at the ON RRP gradually disappeared as the Federal Reserve continued to normalize the size of its balance sheet and reserves in the banking system became less abundant.

Gara Afonso is the head of Banking Studies in the Federal Reserve Bank of New York’s Research and Statistics Group.

Marco Cipriani is head of Money and Payments Studies in the Federal Reserve Bank of New York’s Research and Statistics Group.

Gabriele La Spada is a financial research economist in Money and Payments Studies in the Federal Reserve Bank of New York’s Research and Statistics Group.
How to cite this post:
Gara Afonso, Marco Cipriani, and Gabriele La Spada, “Dropping Like a Stone: ON RRP Take‑up in the Second Half of 2023,” Federal Reserve Bank of New York Liberty Street Economics, December 19, 2023, https://libertystreeteconomics.newyorkfed.org/2023/12/dropping-like-a-stone-on-rrp-take-up-in-the-second-half-of-2023/
BibTeX: View |

Disclaimer
The views expressed in this post are those of the author(s) and do not necessarily reflect the position of the Federal Reserve Bank of New York or the Federal Reserve System. Any errors or omissions are the responsibility of the author(s).
 RSS Feed
 Follow Liberty Street Economics