


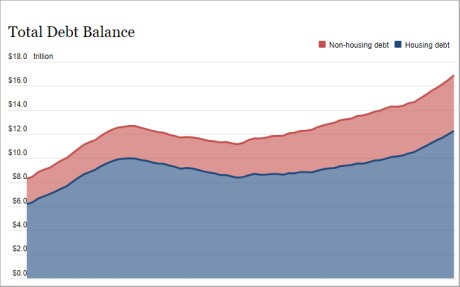
The New York Fed’s Center for Microeconomic Data released the Quarterly Report on Household Debt and Credit for the fourth quarter of 2023 this morning. Household debt balances grew by $212 billion over the last quarter. Although there was growth across most loan types, it was moderate compared to the fourth-quarter changes seen in the past few years. Mortgage balances grew by $112 billion and home equity line of credit (HELOC) balances saw an $11 billion bump as borrowers tapped home equity in lieu of refinancing first mortgages. Credit card balances, which typically see substantial increases in the fourth quarter coinciding with holiday spending, grew by $50 billion, and are now 14.5 percent higher than in the fourth quarter of 2022. Auto loan balances saw a $12 billion increase from the previous quarter, continuing the steady growth that has been in place since 2011. In this post, we revisit our analysis on credit cards and examine which groups are struggling with their auto loan payments. The Quarterly Report and this analysis are based on the New York Fed Consumer Credit Panel (CCP), a panel which is drawn from Equifax credit reports.
Motor vehicles saw some of the most pronounced and persistent price increases during the pandemic inflationary episode, as supply chains and chip shortages limited production. During this spell, auto loan balances ballooned. The average origination amount—that is, the borrowing amount of a car loan—had crept up slowly between 2015 and 2020 at a pace of under one percent each year, reaching about $18,000 in the first quarter of 2020. But when car prices soared in 2021 and 2022, the average amount of newly originated auto loans jumped up as well, by 11 percent through 2021 and another 10 percent in 2022. By the end of 2022, the average origination amount on auto loans was nearly $24,000. In the last year, however, both prices and average auto loan origination amounts have begun to fall. The chart below shows how average auto loan origination amounts have tracked car prices, using the Consumer Price Index (CPI) for new and used motor vehicles, in blue and red respectively, and the average origination amount, in gold.
Borrowing Amounts Loosely Track Car Price Changes
Percentage change in origination amounts since 2018:Q2
Note: CPI is Consumer Price Index.
Household debt delinquencies reached historic lows during the pandemic period, thanks to forbearances on mortgages and federal student loans and stimulus payments. But as forbearances ended and the savings from stimulus payments were exhausted for many households, delinquency rates have been rising again, for all types of debt. The chart below shows the percentage of auto balances newly transitioning to delinquency. Both auto loans and credit cards have seen particular worsening of new delinquencies, with transition rates now above pre-pandemic levels. [Note that the subsequent analysis uses a loan-level data set drawn from the Consumer Credit Panel by the Philadelphia Fed. While similar to the individual-level data used for the Quarterly Report, this alternative loan-level data permits finer analysis by vintage and loan origination amount. Due to some different inclusion criteria, aggregates from tradeline data may differ slightly from those in the Quarterly Report.]
Auto Loan Delinquency Transition Rates Surpass Pre-Pandemic Levels
Percent of balances transitioning into delinquency
Note: The chart shows transition rates into 30-day delinquency and rates are balance-weighted.
Who Is Driving Up Delinquencies?
We now look at delinquency rates by various borrower traits. In the next chart, we examine delinquency by birth generation. Delinquency tends to decrease with age, and younger generations have delinquency rates slightly higher than their predecessors. In our recent post on credit cards, we saw that Millennials (born 1980-1994) have seen delinquency rates worsening more quickly than other generations. For auto loans, this appears to be the case as well, although the disparities here are less pronounced. All generations have delinquency transition rates that have been rising sharply over the past two years, with those for Millennials and Baby Boomers (born 1946-64) now being above their pre-pandemic levels. Note that the data in the next two charts, unlike the previous chart, is annualized using four-quarter moving sums to account for seasonal trends.
Delinquency Transition Rates for Baby Boomers and Millennials Are Now above Pre-Pandemic Levels
Percent of balances transitioning into delinquency
Notes: The chart shows transition rates into 30-day delinquency and rates are balance-weighted. Data are annualized as four-quarter moving sums to account for seasonal trends. Borrowers are grouped by generation using their birth year. Baby Boomers are those born between 1946 and 1964, Generation X are 1965 to 1979, Millennials are 1980 to 1994, and Generation Z are 1995 to 2011.
Next, we show how auto loan delinquency has evolved by zip code average income, as measured by average adjusted gross income from the Internal Revenue Service (IRS) Statistics of Income. While all income areas now have delinquency rates slightly above the pre-pandemic level, this rise is the most pronounced for borrowers in the lowest-income areas, shown on the light blue line.
Delinquencies Rise Most for Borrowers in Low-Income Areas
Percent of balances transitioning into delinquency
Notes: The chart shows transition rates into 30-day delinquency and rates are balance-weighted. Data are annualized as four-quarter moving sums to account for seasonal trends. Borrowers are categorized into income quartiles by ranking zip code average income from lowest to highest and splitting zip codes into four equally sized groups by population.
The chart below shows average monthly payment amounts for new auto loans opened in that quarter, separated by zip code income. Interestingly, average monthly payments are very similar across income areas in nominal terms except for the highest-income quartile. All areas saw similar, sharp increases in payments on auto loans originated since 2019:Q4. However, the increase in monthly payments on loans newly opened in the lowest-income quartile would impose a much greater burden as a share of income than that faced by the highest-income group. The trend for origination amounts by area income (not shown) is similar to the trend for average payments. However, we note that the decline in the average origination balance in recent quarters, shown in the first chart, is not being passed through to the average scheduled payments. This diverging pattern between origination amount and the monthly payment over the last year can be explained by the increase in interest rates on auto loans.
Payments on Newly Opened Auto Loans Climb Sharply
Average monthly payment (in U.S. dollars)
Note: Borrowers are categorized into income quartiles by ranking zip code average income from lowest to highest and splitting zip codes into four equally sized groups by population.
Conclusion
With the pandemic policy supports in the rear-view mirror, delinquency rates for most credit types have been rising after having reached very low levels during 2021. Concentrating on auto loans, delinquency transition rates have pushed past pre-pandemic levels, and the worsening appears to be broad-based. Loans opened during 2022 and 2023 are, so far, performing worse than loans opened in earlier years, perhaps because buyers during these years faced higher car prices and may have been pressed to borrow more, and at higher interest rates. The increasing transition rates merit monitoring in the months ahead, particularly with the amplified distress shown by borrowers in lower-income areas.

Andrew F. Haughwout is director of Household and Public Policy Research in the Federal Reserve Bank of New York’s Research and Statistics Group.

Donghoon Lee is an economic research advisor in Consumer Behavior Studies in the Federal Reserve Bank of New York’s Research and Statistics Group.

Daniel Mangrum is a research economist in Household and Public Policy Research in the Federal Reserve Bank of New York’s Research and Statistics Group.

Joelle Scally is a regional economic advisor in the Federal Reserve Bank of New York’s Research and Statistics Group.

Wilbert van der Klaauw is an economic research advisor on Household and Public Policy Research in the Federal Reserve Bank of New York’s Research and Statistics Group.

Crystal Wang is a research analyst in the Federal Reserve Bank of New York’s Research and Statistics Group.
How to cite this post:
Andrew F. Haughwout, Donghoon Lee, Daniel Mangrum, Joelle Scally, Wilbert van der Klaauw, and Crystal Wang, “Auto Loan Delinquency Revs Up as Car Prices Stress Budgets,” Federal Reserve Bank of New York Liberty Street Economics, February 6, 2024, https://libertystreeteconomics.newyorkfed.org/2024/02/auto-loan-delinquency-revs-up-as-car-prices-stress-budgets/
BibTeX: View |


Disclaimer
The views expressed in this post are those of the author(s) and do not necessarily reflect the position of the Federal Reserve Bank of New York or the Federal Reserve System. Any errors or omissions are the responsibility of the author(s).
 RSS Feed
 Follow Liberty Street Economics