


Inflation around the world increased dramatically with the reopening of economies following COVID-19. After reaching a peak of 11 percent in the second quarter of 2021, world trade prices dropped by more than five percentage points by the middle of 2023. U.S. import prices followed a similar pattern, albeit with a lower peak and a deeper trough. In a new study, we investigate what drove these price movements by using information on the prices charged for products shipped from fifty-two exporters to fifty-two importers, comprising more than twenty-five million trade flows. We uncover several patterns in the data: (i) From 2021:Q1 to 2022:Q2, almost all of the growth in U.S. import prices can be attributed to global factors, that is, trends present in most countries; (ii) at the end of 2022, U.S. import price inflation started to be driven by U.S. demand factors; (iii) in 2023, foreign suppliers to the U.S. market caught up with demand and account for the decline in import price inflation, with a significant role played by China.
Methodology
We use bilateral trade data for all shipments of disaggregated products from an exporting country to an importing country for fifty-two countries, which make up more than 90 percent of U.S. imports. We divided the value of each HS10-country observation by the quantity to form the unit value, which is our measure of the price. We estimate the average change in log prices for each exporter and each importer for each product in each quarter, all relative to the global median price. We refer to the worldwide median as the “global common shock,” the exporter average price change less the median change as the “idiosyncratic supply shock,” and the importer average price change less the median one as the “idiosyncratic demand shock.” Our forthcoming publication in the American Economic Association (AEA) Papers and Proceedings provides more details of this methodology. Below, we summarize our findings, and for this post, we extend the sample period to include 2023.
U.S. Aggregate Import Prices
The chart below plots the decomposition of the changes in aggregate U.S. import prices and shows the sources of the rise and fall of aggregate import price inflation, corresponding to the black line. We also plot each of the three components (common, idiosyncratic U.S. demand, and idiosyncratic export supply price shocks), where we further split the export supply price shock into the element driven by China (dark green) and other exporters to the U.S. (light green). The sum of the colored bars equals the change in the aggregate import prices.
Global Factors Drive Growth in U.S. Import Prices after COVID-19 until Mid-2022
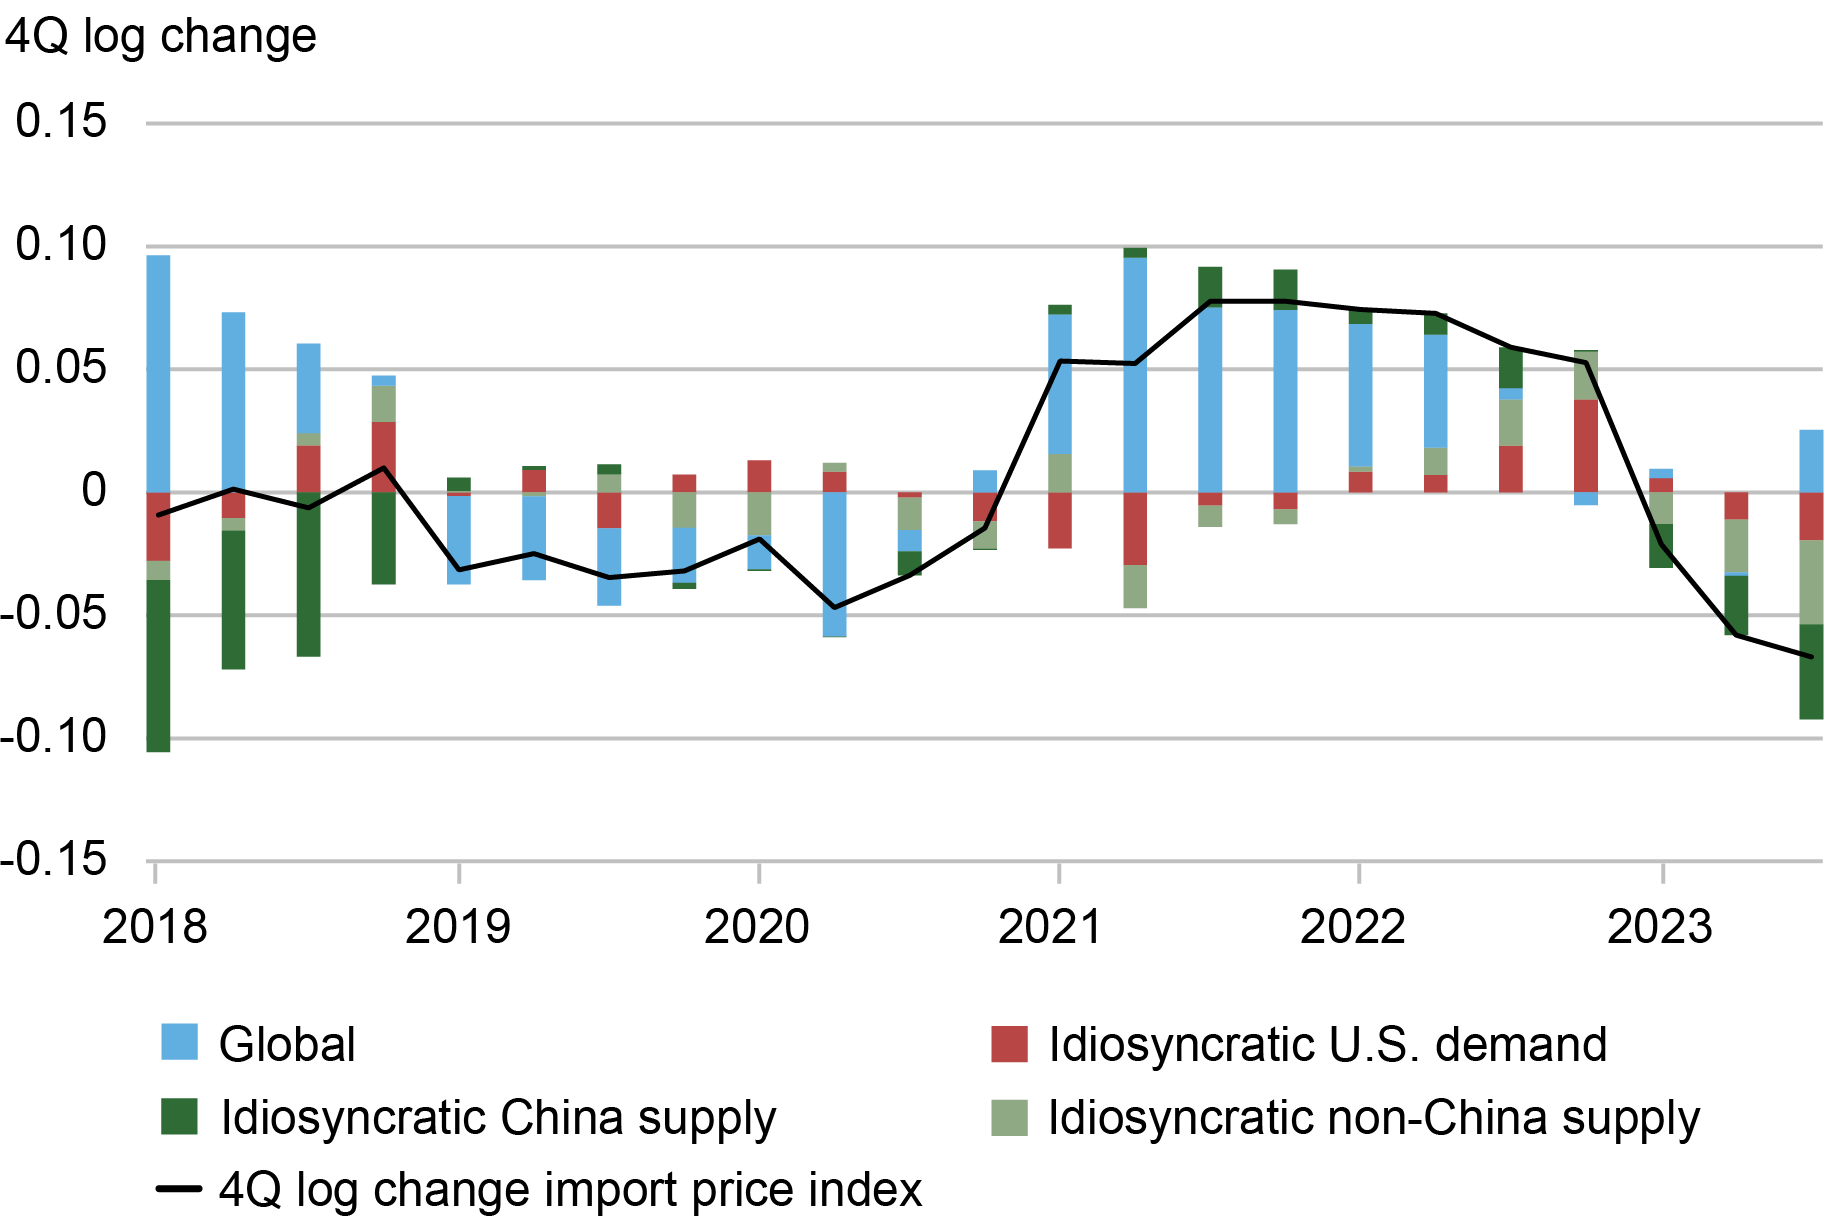
Note: See Amiti, Itskhoki, Weinstein, “What Drives U.S. Import Price Inflation?” for details.
The chart shows that import price inflation was driven mainly by the global common shock (blue bars) until the second half of 2022. Import price inflation rose to 8 percent in the second half of 2021 and fell to -6 percent by the third quarter of 2023. The global common factor (blue bars) played a dominant role in the aftermath of COVID-19 when all countries struggled to re-open their economies. However, by the end of 2022, the global common factor stopped affecting import price inflation. Instead, idiosyncratic U.S. demand and later price reductions by the major exporters to the U.S. played the dominant role in price fluctuations.
In particular, idiosyncratically strong demand in the U.S. maintained high import inflation rates in the second half of 2022. However, this demand effect was short-lived and fell to close to zero at the start of 2023. These findings suggest that most import price inflation was common to all countries until the middle of 2022 and, therefore, cannot be explained by distinctive U.S. policies or policies peculiar to our trading partners. In other words, COVID-19 was a worldwide shock that affected import prices in all countries approximately equally.
As supply chain pressures have eased, import prices have fallen, and we see that idiosyncratic supply shocks have been responsible for the price declines in 2023. Perhaps in response to the high import prices that emerged after COVID-19, the U.S.’s leading suppliers ramped up production and dropped prices. The dark green bars indicate that much of the drop in import prices is due to China, whose exporters dropped prices by more than those in other countries. These patterns suggest that the U.S. import price inflation was not due to a poor choice of trading partners.
In the wake of COVID-19, import prices rose in the U.S. because they rose everywhere and not because of idiosyncratic U.S. demand or decisions made by our leading import suppliers. When U.S. import prices fell in 2023, it was mostly the product of large price drops by China and our other major import suppliers. Some of the decline in the U.S. import prices in 2023 may be due to the relative strength of the U.S. dollar, but we find little correlation between trade-weighted USD and import price inflation over the rest of the sample period.

Mary Amiti is the head of Labor and Product Market Studies in the Federal Reserve Bank of New York’s Research and Statistics Group.
Oleg Itskhoki is a professor of economics at the University of California, Los Angeles.
David E. Weinstein is the Carl S. Shoup Professor of the Japanese Economy at Columbia University.
How to cite this post:
Mary Amiti, Oleg Itskhoki, and David E. Weinstein, “Global Supply Chains and U.S. Import Price Inflation,” Federal Reserve Bank of New York Liberty Street Economics, March 4, 2024, https://libertystreeteconomics.newyorkfed.org/2024/03/global-supply-chains-and-u-s-import-price-inflation/
BibTeX: View |


Disclaimer
The views expressed in this post are those of the author(s) and do not necessarily reflect the position of the Federal Reserve Bank of New York or the Federal Reserve System. Any errors or omissions are the responsibility of the author(s).
 RSS Feed
 Follow Liberty Street Economics