


In the aftermath of the COVID-19 pandemic, the U.S. economy experienced a swift recovery accompanied by a sharp rise in inflation. Inflation has been gradually declining since 2022 without a notable slowdown in the labor market. Nonetheless, inflation remains above the Federal Reserve’s 2 percent target and the path of the so-called final mile remains uncertain, as emphasized by Chair Powell during his press conference in January. In this post, we examine the unemployment-inflation trade-off over the past few years through the lens of a New Keynesian Phillips curve, based on our recent paper. We also provide model-based forecasts for 2024 and 2025 under various labor market scenarios.
Our Model
In our framework (based on earlier work), inflation is driven by transient supply factors, inflation expectations, and labor market conditions. While there are alternative ways to measure labor market conditions, we use the unemployment gap as the building block for characterizing labor market conditions. The unemployment gap is defined as:
where ![]() is the realized unemployment rate and
is the realized unemployment rate and ![]() is the natural rate of unemployment defined in Milton Friedman’s 1968 Presidential Address to the American Economic Association. The natural rate of unemployment is a time-varying unobserved variable that reflects, among other things, secular trends (the aging of the baby boomers, for example), changes in the mismatch between vacant jobs and available workers, or shifts in willingness to work (perhaps due to changing attitudes about work-life balance).
is the natural rate of unemployment defined in Milton Friedman’s 1968 Presidential Address to the American Economic Association. The natural rate of unemployment is a time-varying unobserved variable that reflects, among other things, secular trends (the aging of the baby boomers, for example), changes in the mismatch between vacant jobs and available workers, or shifts in willingness to work (perhaps due to changing attitudes about work-life balance).
The New Keynesian Phillips curve relates inflation to the current unemployment gap (![]() ) and to expectations about future unemployment gaps (
) and to expectations about future unemployment gaps (![]() and so on) and gives us a useful way of decomposing current inflation,
and so on) and gives us a useful way of decomposing current inflation, ![]() , as:
, as:

where ![]() is the slope of the Phillips curve and
is the slope of the Phillips curve and ![]() is the long-run trend in inflation. Note that both the current and expected future unemployment gaps affect inflation through
is the long-run trend in inflation. Note that both the current and expected future unemployment gaps affect inflation through ![]() , a defining feature of the New Keynesian Phillips curve. This equation tells us that inflation is comprised of a fundamental component (“underlying inflation”) and a component reflecting supply shocks (such as global supply-chain disruptions).
, a defining feature of the New Keynesian Phillips curve. This equation tells us that inflation is comprised of a fundamental component (“underlying inflation”) and a component reflecting supply shocks (such as global supply-chain disruptions).
Because the natural rate of unemployment is not observed, we have to estimate it. In our paper, we use a wealth of labor market and inflation data to infer the evolution of ![]() and of economic agents’ expectations about the future path of the unemployment gap. We find a notable increase in
and of economic agents’ expectations about the future path of the unemployment gap. We find a notable increase in ![]() from around 5 percent before the pandemic to 6.6 percent at the end of 2023. We relate this rise to a declining willingness to work, a record-high quits rate (often referred to as the Great Resignation), rising reservation wages, and difficulties in filling vacant jobs, all of which have only recently started to moderate.
from around 5 percent before the pandemic to 6.6 percent at the end of 2023. We relate this rise to a declining willingness to work, a record-high quits rate (often referred to as the Great Resignation), rising reservation wages, and difficulties in filling vacant jobs, all of which have only recently started to moderate.
Analyzing Recent Disinflation
This high level of the natural rate relative to the much lower unemployment rate (which has remained below 4 percent since the end of 2021) would have suggested upward inflationary pressures.
So why has inflation been on a declining trend since 2022 amid such a tight labor market? There are two reasons: First, global supply chain disruptions, which had put upward pressure on inflation starting in 2021, have abated; second, what matters for inflation is less about the current unemployment gap and more about the expected path of future gaps going forward.
To confront the data with the model, we can go back to the second quarter of 2022 (approximately when inflation peaked) and see what the model anticipated. Importantly, when we perform this exercise we don’t give the model any information beyond what was available at that time.
The Model’s Unemployment Forecast Aligns with Professional Forecasts
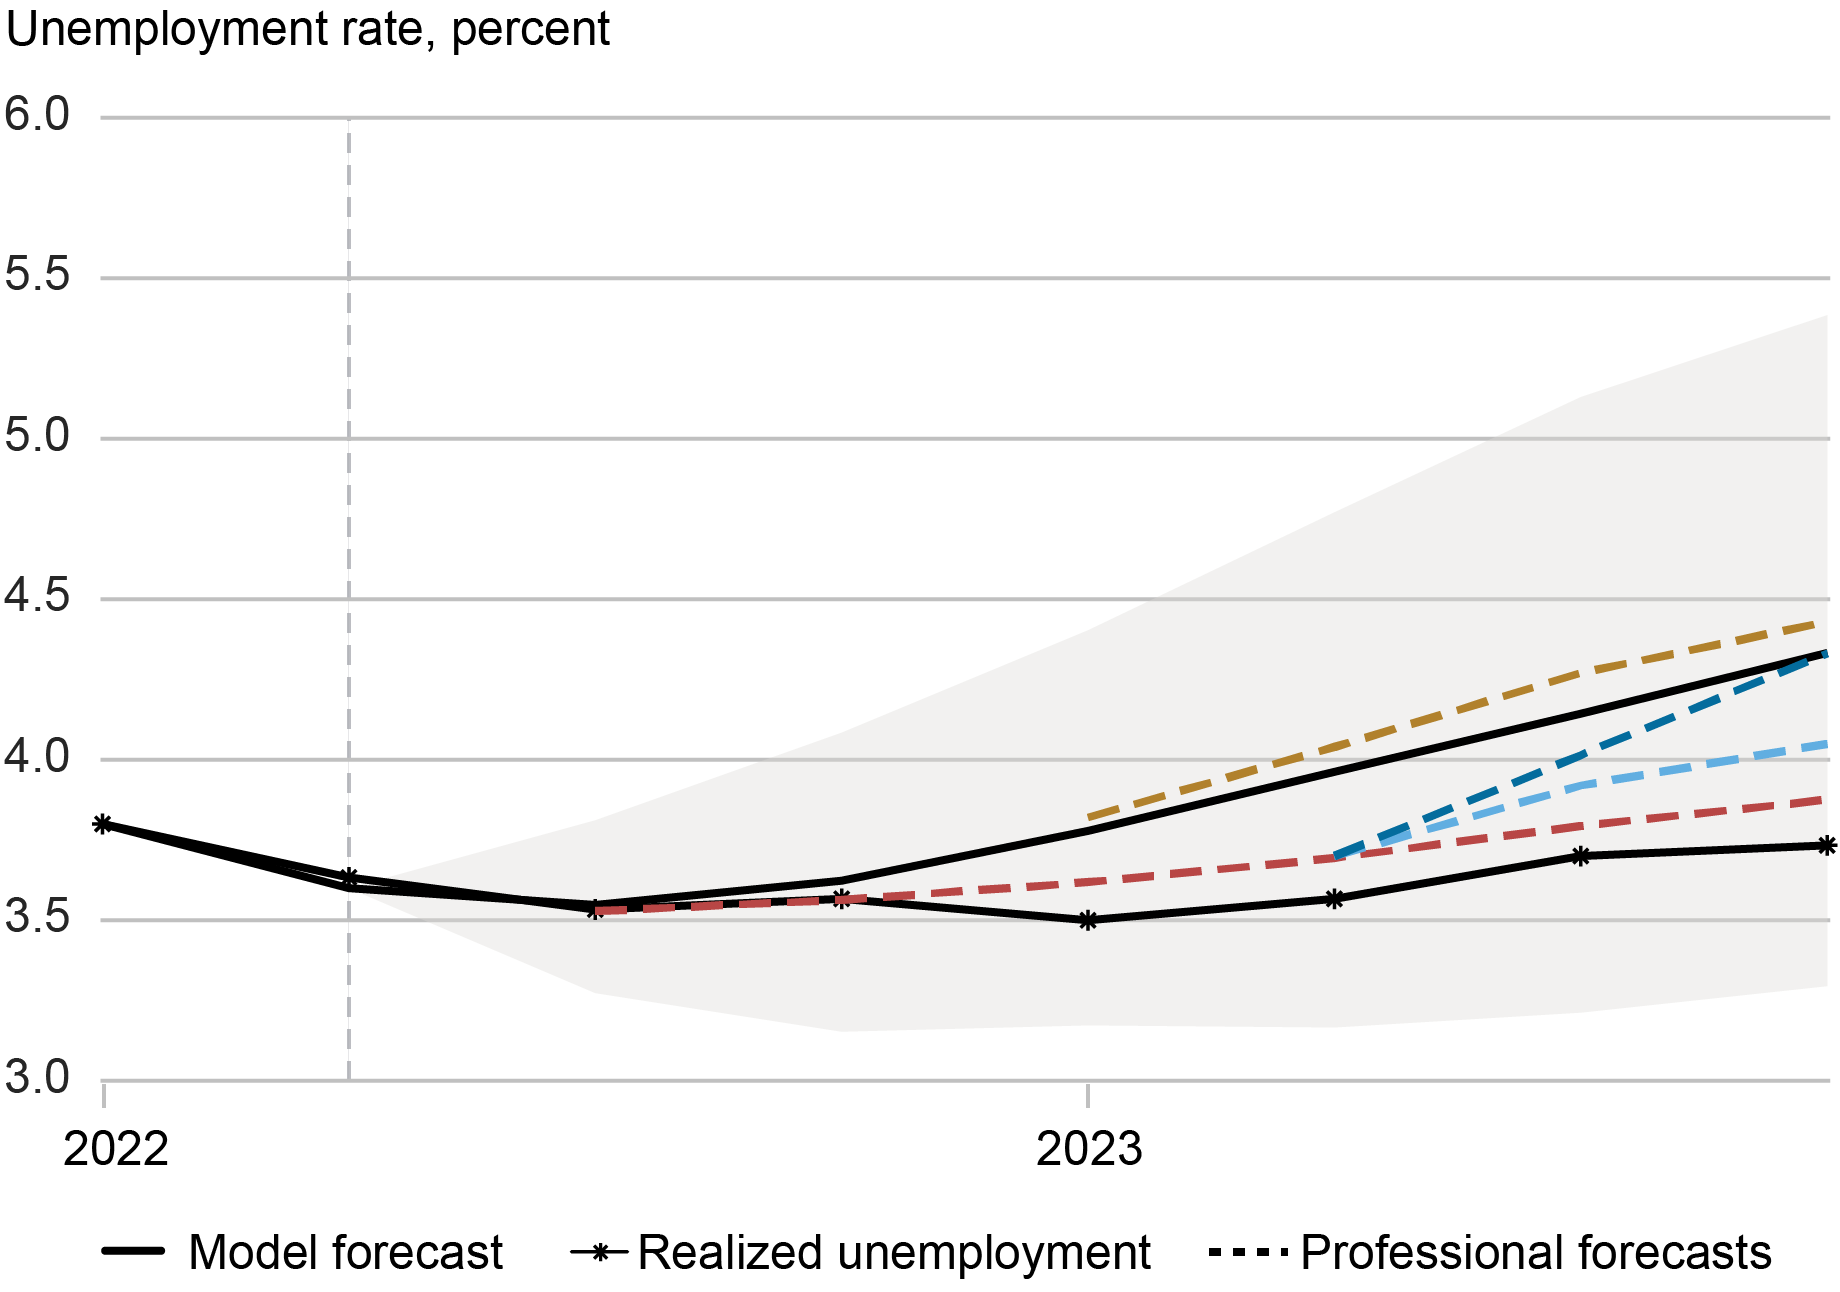
Notes: This chart shows the model forecast path for the unemployment rate (black line) as of 2022:Q2 (delineated by dashed vertical line), along with the realized unemployment rate (line with asterisks). Dashed lines denote forecast paths from the Survey of Professional Forecasters and the Blue Chip Economic Indicators Survey at different times. Grey shaded regions denote 68 percent posterior coverage intervals.
The chart above shows the unemployment rate forecast generated by our model as of the second quarter of 2022, along with the realized unemployment rate. Clearly, the model forecast was higher than the actual unemployment rate over this period—but that projection aligns with the expectations of professional forecasters at the time, also plotted above. This expectation of a gradual increase in the unemployment rate then drives the gradual decline in underlying inflation, which is shown in the chart below.
Realized Inflation Converged to the Model Forecast for Underlying Inflation
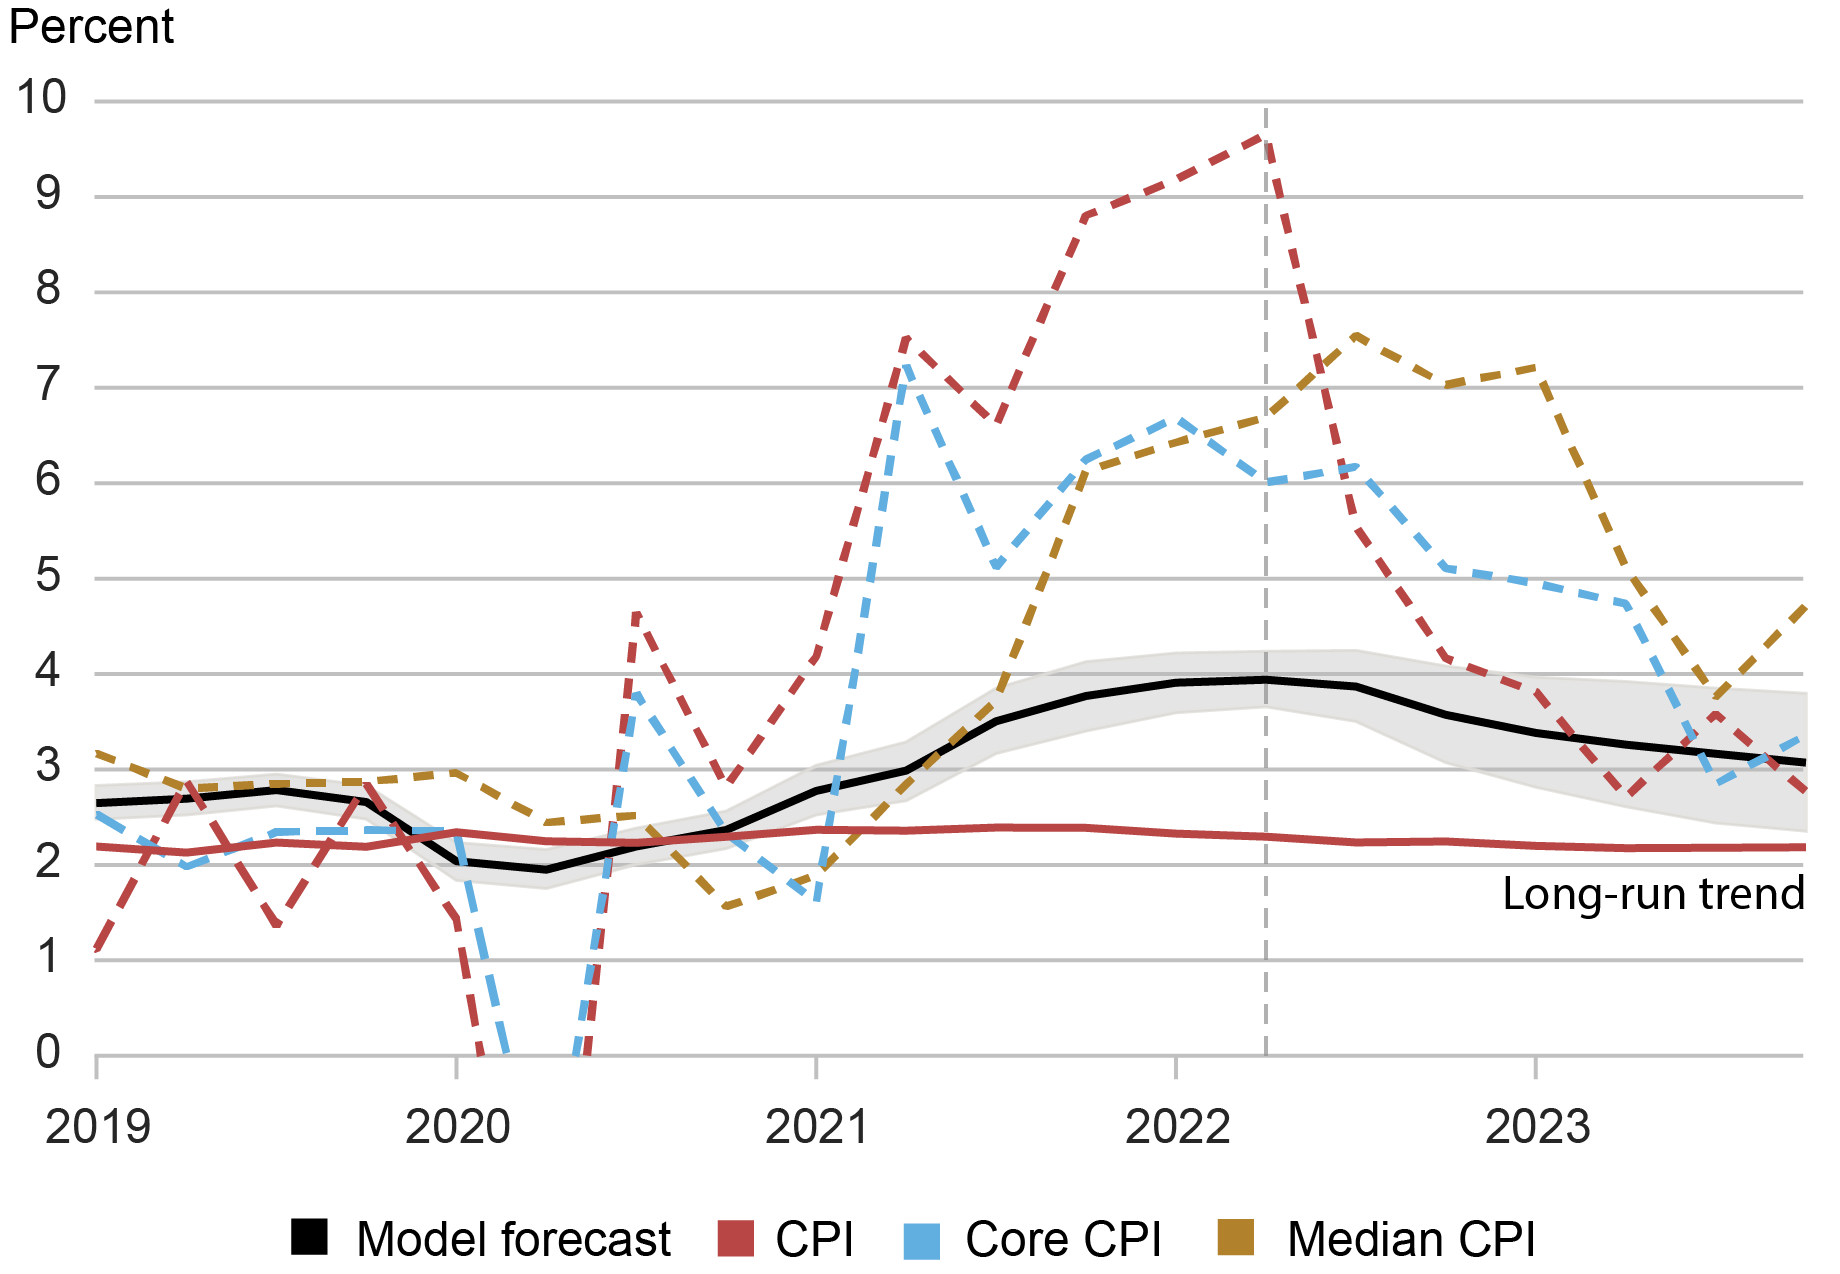
Notes: This chart shows the model forecast path for underlying inflation (black line) as of 2022:Q2 (delineated by the vertical line). Dashed lines denote realized CPI inflation, core CPI inflation, and median CPI inflation from the Federal Reserve Bank of Cleveland. Grey shaded regions denote 68 percent posterior coverage intervals.
We can see that all of the realized inflation measures converged to almost the exact same place: the model forecast for underlying inflation. This tells us two things. First, it shows that underlying inflation is an important object for better understanding the medium-term behavior of inflation. Second, it gives us confidence in our model’s forecasting ability.
The disinflation that occurred from 2022 to 2023 thus shows how the behavior of inflation depends critically on expectations of changes in labor market conditions and, therefore, on expectations of macroeconomic policy.
Current Inflation Outlook According to Our Model
So what is the model’s current forecast for 2024 and beyond? In the chart below, we show the forecast for underlying inflation using information up to the fourth quarter of 2023. First, since supply shocks have dissipated, achieving the Fed’s 2 percent inflation target requires underlying inflation, itself, to reach that target. The model predicts that further disinflation—the final mile—is likely to be gradual. It bears emphasizing that these are our model-based forecasts and not official projections.
What affects the speed of disinflation? In the chart below, the left panel presents three forecast scenarios for inflation based on possible future paths of the unemployment rate, shown in the right panel. When the unemployment rate rises faster than the baseline forecast, then underlying inflation reaches its long-run trend (red line) by the end of 2025 (gold line). However, when the unemployment rate moves sideways, then the pace of disinflation is slower (blue line).
Labor Market Conditions Define the Disinflation Path
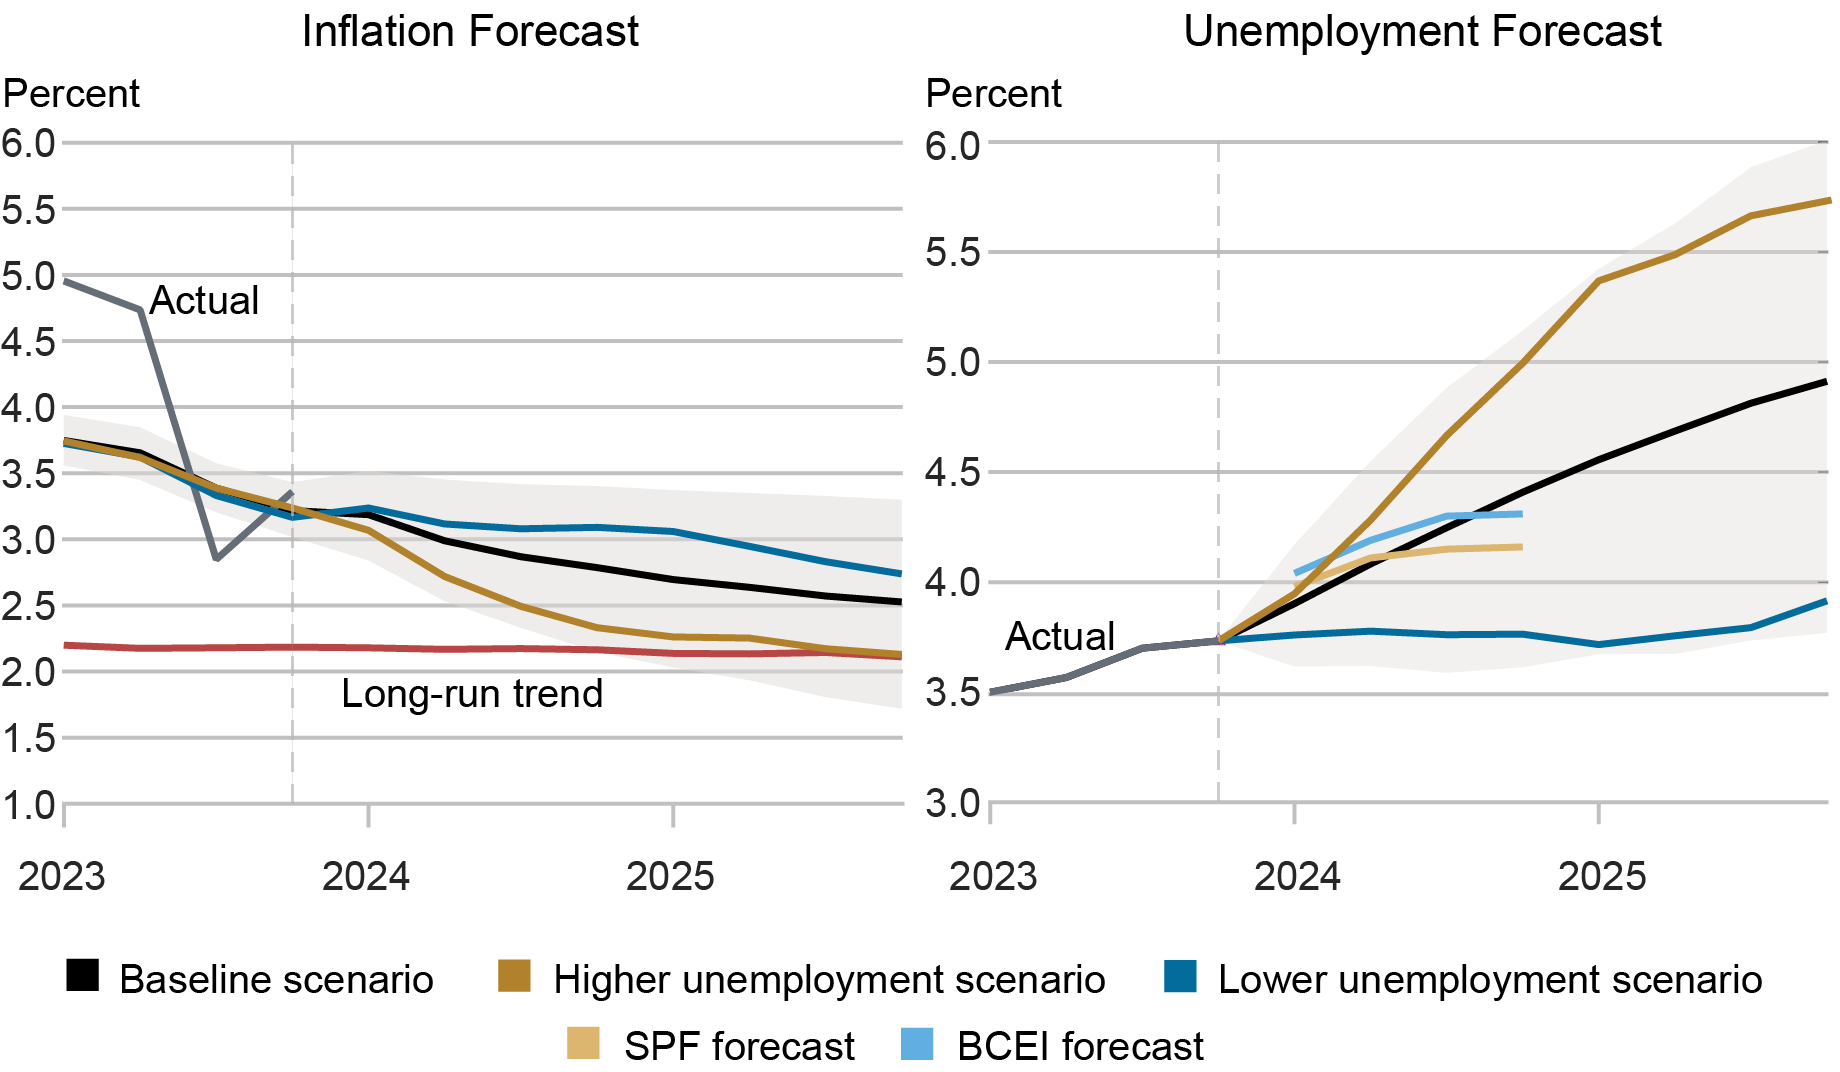
Notes: This chart shows the model forecast path for underlying inflation (black line, left panel) and the unemployment rate (black line, right panel) as of 2023:Q4 (delineated by vertical line). The gold line shows the inflation forecast based on a steeper increase in the forecasted unemployment rate; the dark blue line shows the inflation forecast based on a shallower increase in the forecasted unemployment rate. The solid red line in the left panel denotes the long-run trend in inflation. Grey shaded regions denote 68 percent posterior coverage intervals. The pair of short lines in the right panel show unemployment rate forecasts from the Survey of Professional Forecasters (SPF) and the Blue Chip Economic Indicators (BCEI) Survey as of end-2023.
For comparison, the right panel also shows the expected path of the unemployment rate from the Survey of Professional Forecasters (SPF) and the Blue Chip Economic Indicators (BCEI) Survey as of the end of last year. These expected paths are broadly consistent with the model’s unemployment rate forecasts. However, as we learned from the 2022-23 period, the disinflation process will depend critically on expected macroeconomic conditions. Changes in these expectations will then have direct implications for the path for inflation.

Richard K. Crump is a financial research advisor in Macrofinance Studies in the Federal Reserve Bank of New York’s Research and Statistics Group.
Stefano Eusepi is an associate professor of economics at the University of Texas at Austin.
Ayşegül Şahin is the Richard J. Gonzalez Regents Chair in Economics at the University of Texas at Austin and an adviser to the Federal Reserve Bank of Dallas.
How to cite this post:
Richard K. Crump, Stefano Eusepi, and Ayşegül Şahin, “Expectations and the Final Mile of Disinflation,” Federal Reserve Bank of New York Liberty Street Economics, March 5, 2024, https://libertystreeteconomics.newyorkfed.org/2024/03/expectations-and-the-final-mile-of-disinflation/
BibTeX: View |


Disclaimer
The views expressed in this post are those of the author(s) and do not necessarily reflect the position of the Federal Reserve Bank of New York or the Federal Reserve System. Any errors or omissions are the responsibility of the author(s).
 RSS Feed
 Follow Liberty Street Economics