


This post presents an update of the economic forecasts generated by the Federal Reserve Bank of New York’s dynamic stochastic general equilibrium (DSGE) model. We describe very briefly our forecast and its change since June 2024. As usual, we wish to remind our readers that the DSGE model forecast is not an official New York Fed forecast, but only an input to the Research staff’s overall forecasting process. For more information about the model and variables discussed here, see our DSGE model Q & A.
The New York Fed model forecasts use data released through 2024:Q2, augmented for 2024:Q3 with the median forecasts for real GDP growth and core PCE inflation from the August release of the Philadelphia Fed Survey of Professional Forecasters (SPF), as well as the yields on 10-year Treasury securities and Baa-rated corporate bonds based on 2024:Q3 averages up to August 21. Starting in 2021:Q4, the expected federal funds rate (FFR) between one and six quarters into the future is restricted to equal the corresponding median point forecast from the latest available Survey of Primary Dealers (SPD) in the corresponding quarter. For the current projection, this is the July SPD.
The economy was much stronger in 2024:Q2 than the SPF had predicted in May. The DSGE model, which in June used the SPF forecast to produce a nowcast for Q2, was therefore also surprised by the strength of GDP. Moreover, the current SPF nowcast for Q3 GDP growth is also stronger than what the DSGE model had predicted in June. Both surprises translate into higher output growth for 2024 relative to the June forecast (1.8 percent versus 1.0 percent), but they have little impact on the output projections thereafter (the current forecasts are 1.0, 0.8, and 1.3 percent for 2025, 2026, and 2027, respectively, versus June forecasts of 0.9 and 1.1 percent for 2025 and 2026). To be sure, the DSGE model still forecasts growth to moderate over the next several quarters relative to last year, but this moderation is less sharp than was predicted in June. As a consequence, the model predicts a less negative output gap going forward than it did in June. The probability of a recession, defined as four-quarter output growth falling below -1 percent, over the next four quarters has decreased, going from 37 percent in June to 31 percent now.
Core PCE inflation forecasts are slightly higher than they were in June. In June, the model correctly predicted the decline in inflation in 2024:Q2 relative to Q1 and its forecast for the current quarter was in line with the current SPF nowcast. However, while in June the DSGE model expected core inflation to drop below 2 percent in the last quarter of the current year, then fall as low as 1.6 percent in 2026, the current projections are closer to 2 percent. Specifically, the current inflation forecasts are 2.8, 1.8, 1.8, and 1.8 percent for 2024, 2025, 2026, and 2027, respectively, versus June forecasts of 2.7, 1.7, and 1.6 percent for 2024, 2025, and 2026, respectively.
The model’s assessment of the monetary policy stance has not changed much since June in that its forecasts for both the federal funds rate and the short-run real natural rate of interest, r*, are not very different from what they were last quarter. In particular, the DSGE model expects the federal funds rate to fall over the coming quarters, in line with the SPD predictions, while r* is expected to decline but at a slower pace, implying that policy is expected to be less restrictive than it is now going forward. The current forecast puts r* at 2.4, 2.3, 1.9, and 1.6 percent in 2024, 2025, 2026, and 2027, respectively.
Forecast Comparison
| Forecast Period | 2024 | 2025 | 2026 | 2027 | ||||
|---|---|---|---|---|---|---|---|---|
| Date of Forecast | Sep 24 | Jun 24 | Sep 24 | Jun 24 | Sep 24 | Jun 24 | Sep 24 | Jun 24 |
| GDP growth (Q4/Q4) | 1.8 (0.1, 3.6) | 1.0 (-2.1, 4.0) | 1.0 (-4.2, 6.3) | 0.9 (-4.2, 6.2) | 0.8 (-4.4, 6.2) | 1.1 (-4.1, 6.4) | 1.3 (-4.2, 6.7) | 1.9 (-3.7, 7.5) |
| Core PCE inflation (Q4/Q4) | 2.8 (2.5, 3.0) | 2.7 (2.3, 3.1) | 1.8 (1.0, 2.5) | 1.7 (0.9, 2.5) | 1.8 (0.8, 2.7) | 1.6 (0.6, 2.5) | 1.8 (0.8, 2.9) | 1.6 (0.6, 2.7) |
| Real natural rate of interest (Q4) | 2.4 (1.2, 3.6) | 2.5 (1.2, 3.7) | 2.3 (0.9, 3.7) | 2.2 (0.8, 3.7) | 1.9 (0.3, 3.4) | 1.9 (0.3, 3.5) | 1.6 (-0.1, 3.2) | 1.6 (-0.1, 3.3) |
Notes: This table lists the forecasts of output growth, core PCE inflation, and the real natural rate of interest from the September 2024 and June 2024 forecasts. The numbers outside parentheses are the mean forecasts, and the numbers in parentheses are the 68 percent bands.
Forecasts of Output Growth
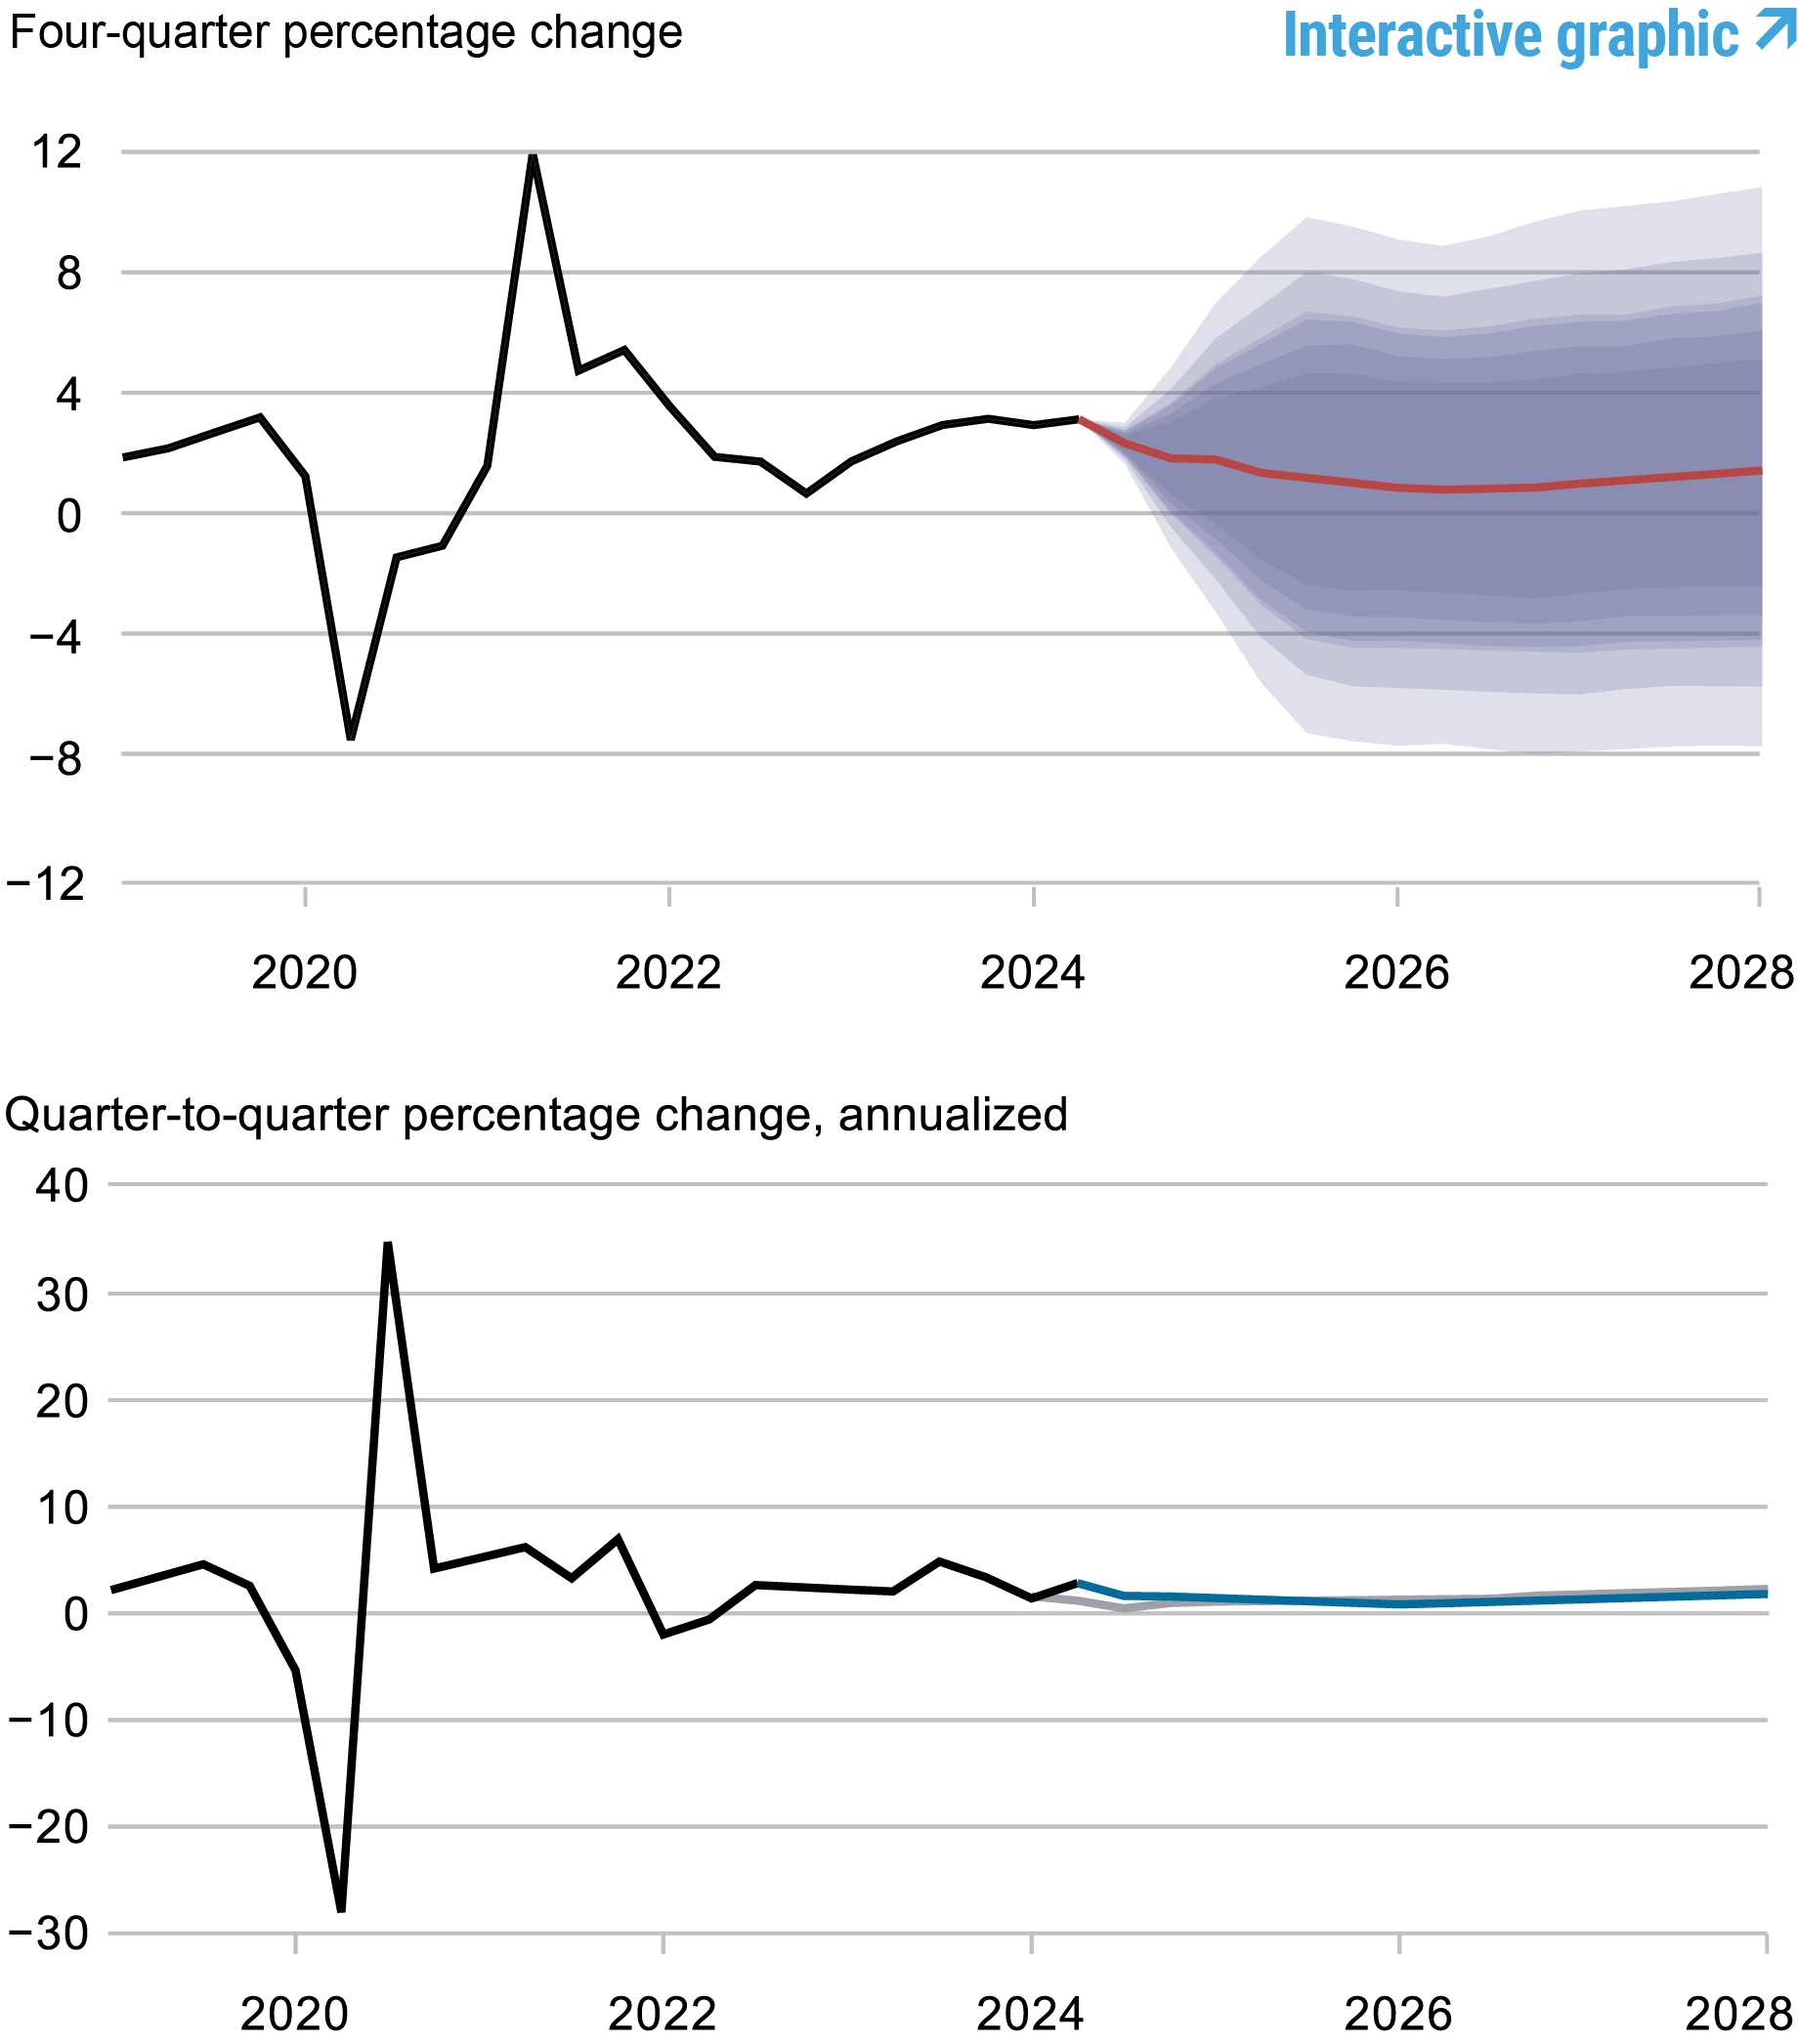
Source: Authors’ calculations.
Notes: These two panels depict output growth. In the top panel, the black line indicates actual data and the red line shows the model forecasts. The shaded areas mark the uncertainty associated with our forecasts at 50, 60, 70, 80, and 90 percent probability intervals. In the bottom panel, the blue line shows the current forecast (quarter-to-quarter, annualized), and the gray line shows the June 2024 forecast.
Forecasts of Inflation
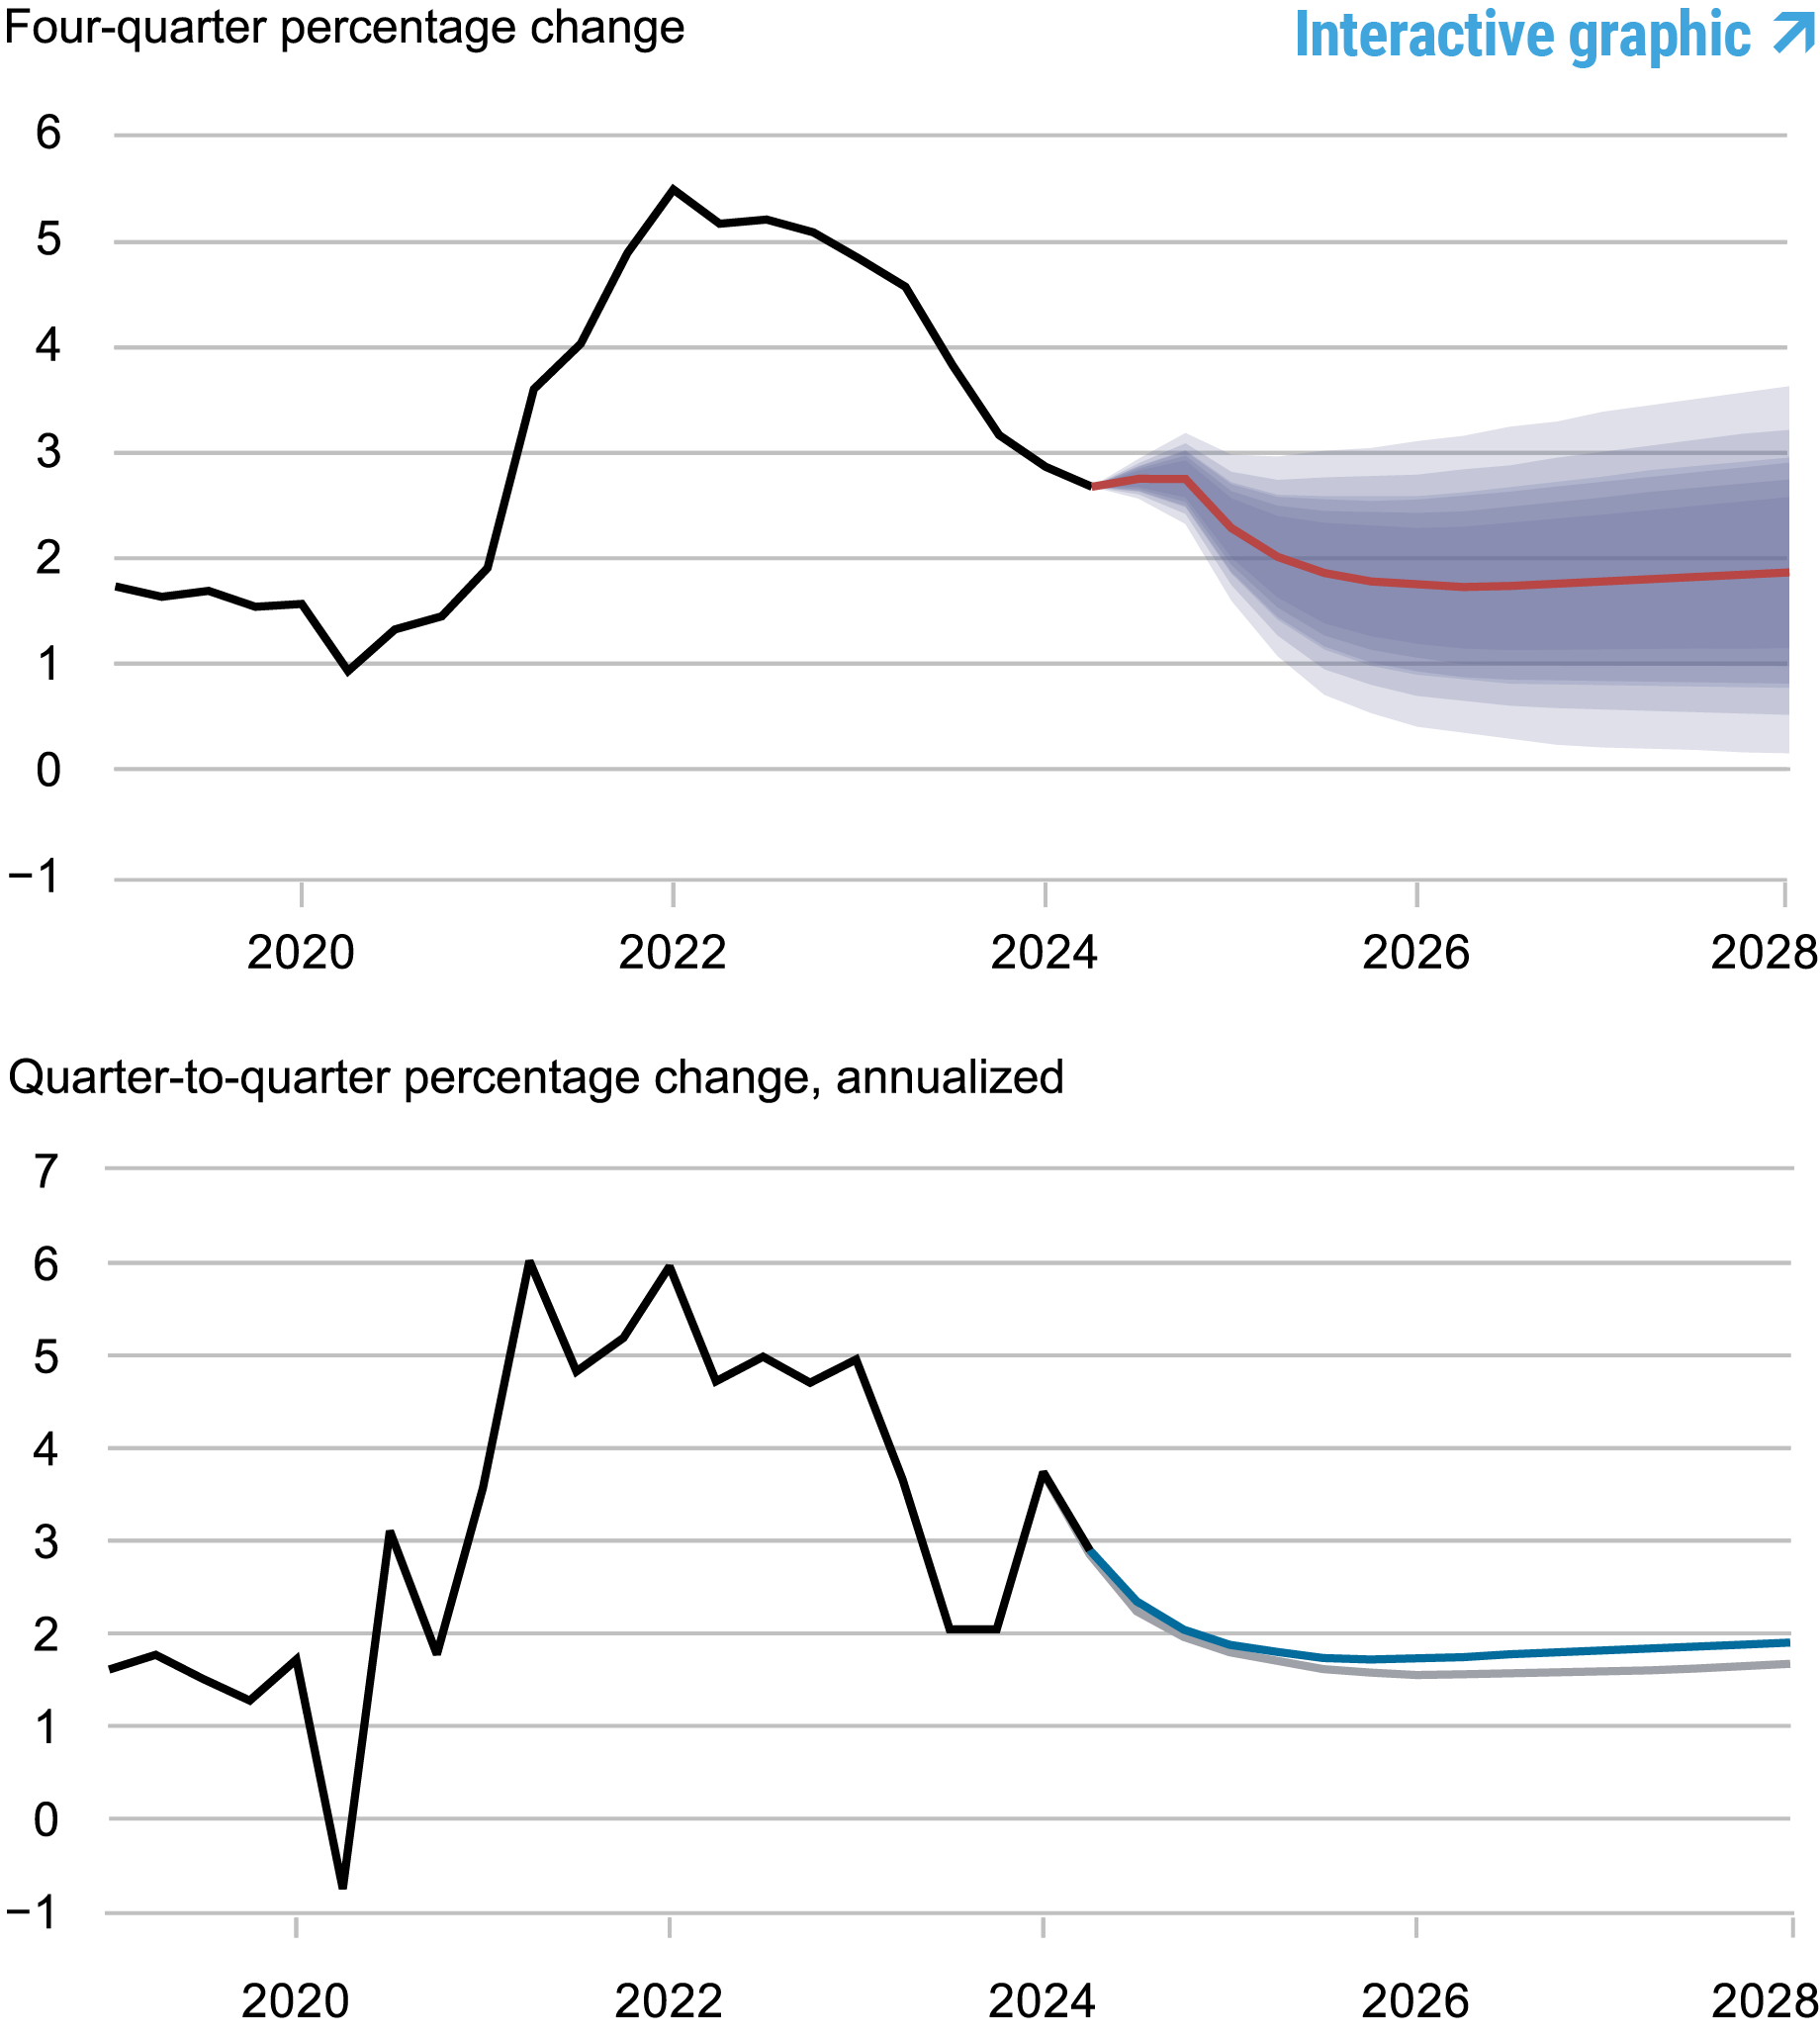
Source: Authors’ calculations.
Notes: These two panels depict core personal consumption expenditures (PCE) inflation. In the top panel, the black line indicates actual data and the red line shows the model forecasts. The shaded areas mark the uncertainty associated with our forecasts at 50, 60, 70, 80, and 90 percent probability intervals. In the bottom panel, the blue line shows the current forecast (quarter-to-quarter, annualized), and the gray line shows the June 2024 forecast.
Real Natural Rate of Interest
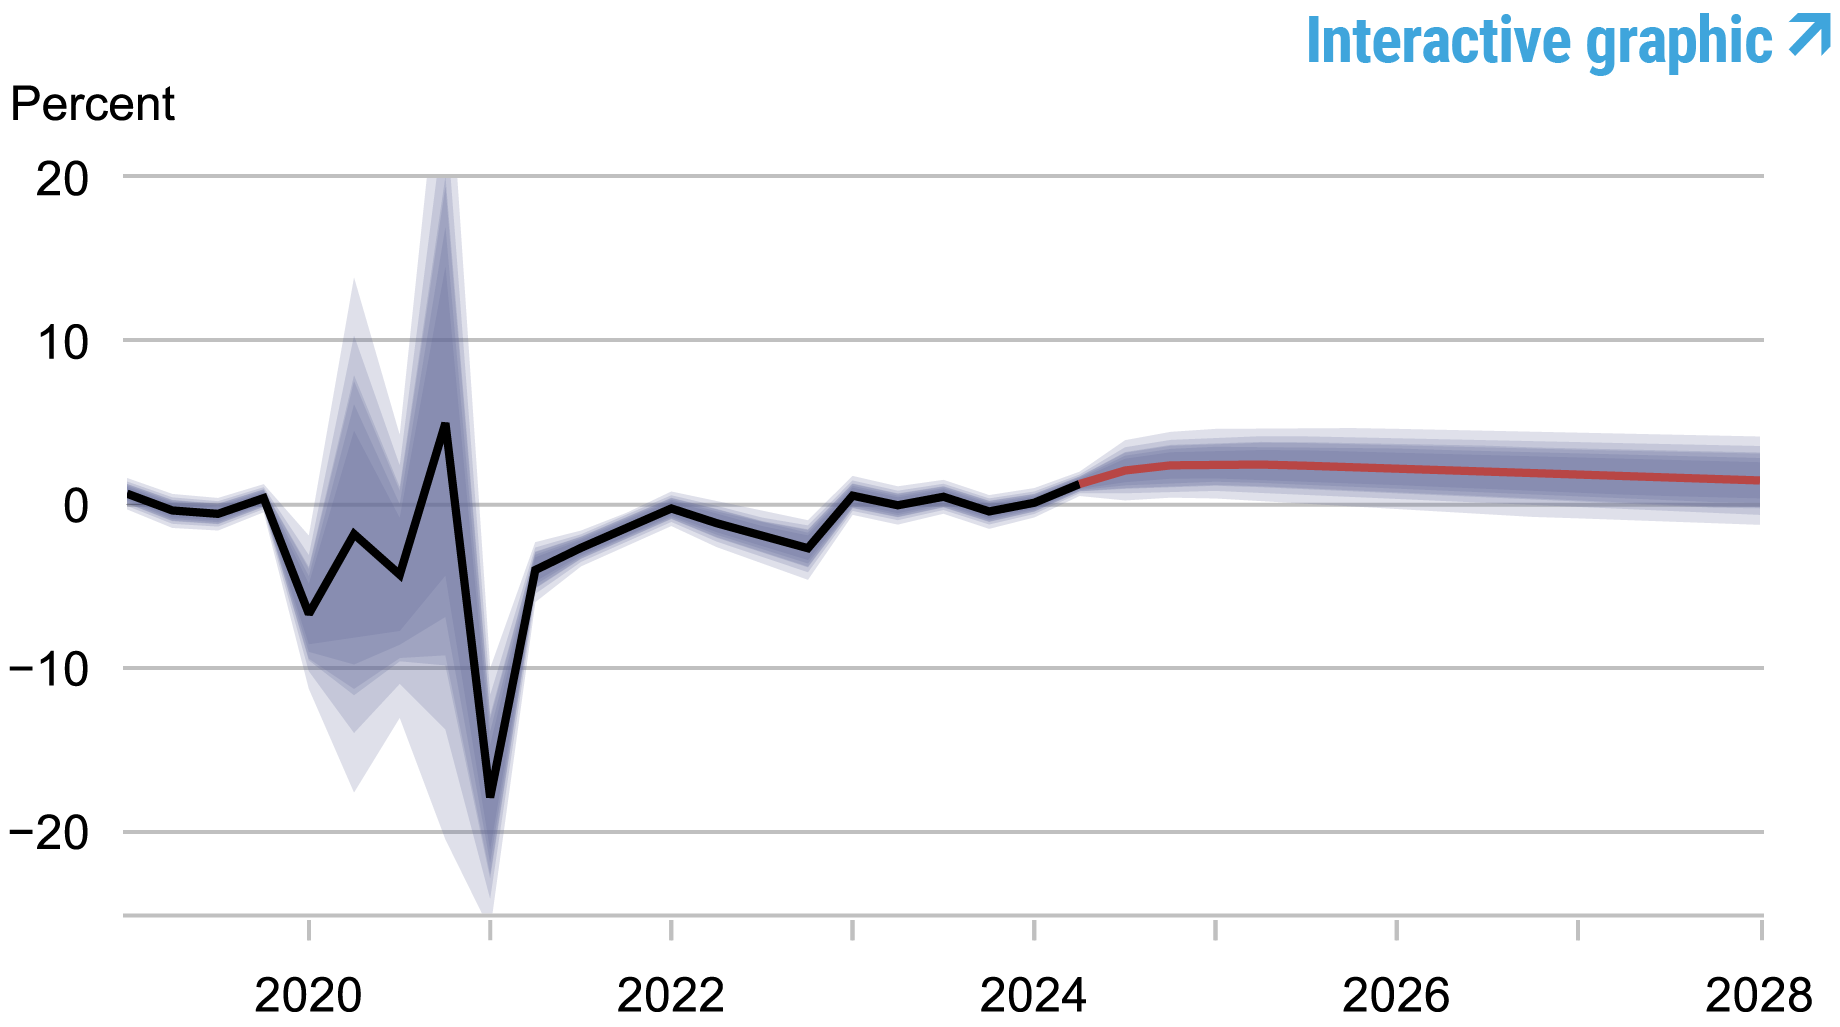
Source: Authors’ calculations.
Notes: The black line shows the model’s mean estimate of the real natural rate of interest; the red line shows the model forecast of the real natural rate. The shaded area marks the uncertainty associated with the forecasts at 50, 60, 70, 80, and 90 percent probability intervals.

Sophia Cho is a research analyst in the Federal Reserve Bank of New York’s Research and Statistics Group.

Marco Del Negro is an economic research advisor in Macroeconomic and Monetary Studies in the Federal Reserve Bank of New York’s Research and Statistics Group.

Ibrahima Diagne is a research analyst in the Federal Reserve Bank of New York’s Research and Statistics Group.

Pranay Gundam is a research analyst in the Federal Reserve Bank of New York’s Research and Statistics Group.

Donggyu Lee is a research economist in Macroeconomic and Monetary Studies in the Federal Reserve Bank of New York’s Research and Statistics Group.

Brian Pacula is a research analyst in the Federal Reserve Bank of New York’s Research and Statistics Group.
How to cite this post:
Sophia Cho, Marco Del Negro, Ibrahima Diagne, Pranay Gundam, Donggyu Lee, and Brian Pacula , “The New York Fed DSGE Model Forecast—September 2024,” Federal Reserve Bank of New York Liberty Street Economics, September 20, 2024, https://libertystreeteconomics.newyorkfed.org/2024/09/the-new-york-fed-dsge-model-forecast-september-2024/
BibTeX: View |


Disclaimer
The views expressed in this post are those of the author(s) and do not necessarily reflect the position of the Federal Reserve Bank of New York or the Federal Reserve System. Any errors or omissions are the responsibility of the author(s).
 RSS Feed
 Follow Liberty Street Economics