











This post is the first in a three-part series on how bank regulation interacts with the organizational structure of banking firms. The series draws on the authors’ recent Staff Report, “Regulatory Arbitrage Within the Firm.”
When economists and policymakers talk about nonbank finance, they usually have in mind activity that takes place outside the banking system in institutions that compete with banks for the provision of financial intermediation services, such as fintech lenders, money market funds, private credit vehicles, insurers, and broker-dealers. A substantial share of U.S. nonbank financial activity, however, takes place inside bank holding companies (BHCs), conducted by nonbank subsidiaries that operate alongside regulated commercial banks under common ownership and integrated management. In this first post of our three-part series, we document the scale of nonbank activity within BHCs and describe the balance-sheet features that, as the remainder of the series shows, make these subsidiaries a vehicle for regulatory arbitrage.
BHCs Account for One in Four Dollars of Nonbank Intermediation
The modern BHC is a complex organization comprising dozens, in some cases hundreds, of legally separate subsidiaries, including depository institutions but also a wide range of nonbank financial entities. Using regulatory filings linked through a comprehensive database of BHC organizational structure, we estimate that nonbank subsidiaries account for roughly 20 to 30 percent of consolidated BHC assets in the post-2010 period, with broker-dealers making up the largest single component (see the chart below). From the perspective of the aggregate U.S. nonbank sector, roughly one in four dollars of nonbank financial intermediation today is conducted by an entity whose parent owns a regulated bank, a share that has grown steadily over the years.
Nonbank Activity Within and Across the BHC Sector
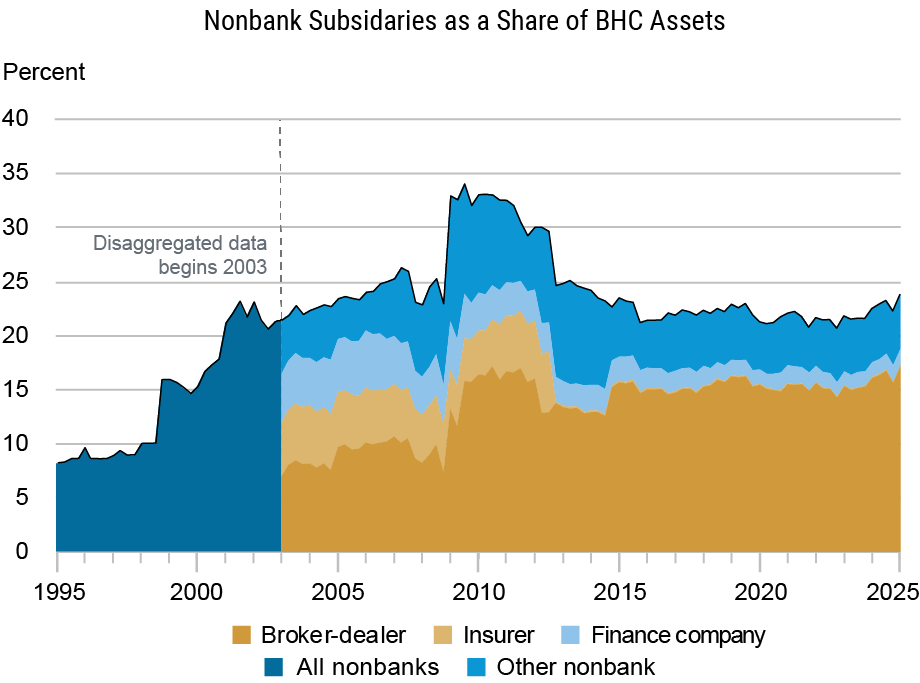
Nonbank Subsidiaries of BHCs as a Share of Aggregate
U.S. Nonbank Financial Assets
Percent
Notes: The top panel shows the size of nonbank business lines as a share of consolidated BHC assets from 1995 to 2025. The black line plots the ratio of total nonbank assets to BHC assets, with stacked colored areas decomposing this aggregate into broker-dealers, insurers, finance companies, and other nonbank business lines. The bottom panel presents the percentage of aggregate nonbank assets attributable to BHC subsidiaries from 2005-25. This measure is constructed as the ratio of BHC-affiliated nonbank assets (from the FR Y-9LP) to aggregate nonbank assets (from the Financial Accounts of the United States). The denominator is constructed using asset-level proxies for broker-dealers, ABS, equity REITs, finance companies, life insurers, mortgage REITs, other financial business, P&C insurers, and closed-end funds. Mutual fund and ETF assets under management are excluded from industry totals as they are not included in the FR Y-9LP numerator.
The spike around the financial crisis reflects the conversion of Goldman Sachs and Morgan Stanley to BHC status in 2008. But even absent that episode, the broader trend is unmistakable: nonbank activity has become increasingly embedded within banking organizations. While the largest dollar volumes are concentrated in the biggest and most complex BHCs, roughly two-thirds of BHCs with between $1 billion and $10 billion in consolidated assets operate at least one nonbank subsidiary. In other words, having a nonbank footprint is a feature of the modern bank holding company more broadly.
These subsidiaries operate under direct parental control. As shown in the chart below, 73 percent of nonbank subsidiary-quarters in our sample are wholly owned by the parent BHC, and an additional 17 percent are majority-owned, so that 90 percent of nonbank subsidiaries fall under direct parental control.
BHC Ownership of Nonbank Subsidiaries
Percent
Notes: This chart shows the share of direct nonbank subsidiaries that are wholly owned by their parent bank holding company (BHC) and the share that are majority owned by their parent BHC. The sample period is 2010-24. Only nonbanks in the BHC’s direct ownership chain are considered. Subsidiary types are classified by NAICS code: Broker (523), Nonbank Lender (5222-5223), Insurer (524), Fund (525), and REIT (531).
This ownership structure gives the parent effective authority over subsidiary capital allocation, dividend policy, and financing decisions, the margins through which, as our next post shows, capital is reallocated across the organization.
The Capital Is Not Where the Assets Are
Prudential banking regulation is centered on capital requirements that apply to the depository institution and to the consolidated holding company, but not to nonbank subsidiaries individually. A bank must hold common equity above specified minimums relative to its risk-weighted assets. Many nonbank affiliates within the same organization face substantially lighter capital regulation. As a result, different subsidiaries operating under the same parent can face very different capital constraints.
This regulatory asymmetry coincides with an equally striking asymmetry in how the two types of subsidiaries are financed. Banks are highly leveraged institutions. Access to insured deposits allows them to fund a large share of their balance sheets with debt, so equity ratios tend to be relatively low and often cluster near regulatory requirements. The median bank subsidiary holds equity equal to roughly 10 percent of assets. Nonbank affiliates, by contrast, lack access to insured deposits and rely more heavily on equity funding. The median nonbank subsidiary has an equity-to-asset ratio of 69 percent.
As a result, equity within the organization is distributed quite differently from assets, creating what we call the “equity multiplier,” defined as the nonbank share of consolidated equity divided by the nonbank share of consolidated assets. The median nonbank subsidiary accounts for a little under 2 1/2 percent of consolidated assets but nearly 16 percent of consolidated equity, for a multiplier of 6.5. The ratio is highest for funds and asset managers; even nonbank lenders, the most leveraged category, carry a multiplier near 5 (see chart below). Nonbank affiliates function as equity reservoirs: small balance sheets holding a disproportionate share of the organization's redeployable capital.
Equity Multiplier Varies by Nonbank Subsidiary Type
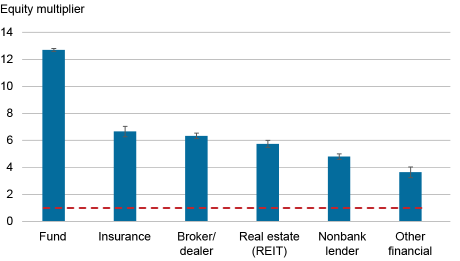
Notes: The chart presents the mean equity multiplier by nonbank subsidiary type with 95 percent confidence intervals. Equity multiplier is constructed as the ratio of subsidiary equity share to subsidiary asset share within bank holding company (BHC), measuring capital intensity. Error bars show 95 percent confidence intervals
How Capital Moves Within the Firm
Whether this stock of nonbank equity matters for the rest of the organization depends on how resources move within BHCs. A growing literature has shown that BHCs actively reallocate liquidity across subsidiaries through internal capital markets, using intra-firm loans, deposits, and other funding arrangements to respond to shocks and funding pressures. Recent work has emphasized how these internal liquidity networks connect banks and nonbank affiliates within the same organization.
Our evidence points to an additional channel. Alongside liquidity reallocation, equity reallocation is a quantitatively dominant margin within these organizations. Decomposing parent investments in bank subsidiaries, we find that equity positions exceed non-equity positions by an order of magnitude (see chart below). Parent equity investments in banks average 10–11 percent of bank assets over 2005–24, while non-equity investments such as loans and receivables total just 1–2 percent, and net borrowing among affiliates remains close to zero throughout the sample.
Parent Investments in Bank Subsidiaries: Equity vs. Non-Equity
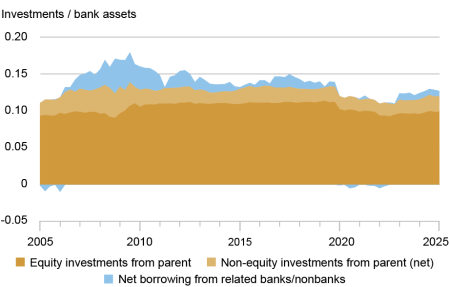
Notes: This chart shows parent BHC equity and nonequity investments in bank subsidiaries, as well as net intra-company borrowing, scaled by bank subsidiary assets. Equity investments in bank subsidiaries are defined as the sum of BHC equity investments in common stock, goodwill, and other intangibles. Nonequity investments in bank subsidiaries are defined as the sum of BHC investments in loans and other receivables and net balances due from subsidiaries (balances due from bank subsidiaries minus balances due to bank subsidiaries). Net borrowing from related banks and nonbanks is defined as balances held by subsidiary banks due to related banks and nonbanks minus balances held by subsidiary banks due from related banks and nonbanks. Variables are aggregated across all BHCs in the sample using value-weighted averages.
These patterns suggest that when regulation operates through capital requirements, equity transfers become an especially important organizational margin of adjustment.
A Divergence Emerges in 2015
These facts raise a natural question: if nonbank subsidiaries hold a disproportionate share of organizational equity, and equity is the operative internal channel, how do BHCs respond when capital requirements on their bank subsidiaries tighten? The answer begins to emerge in 2015, when Basel III's minimum capital requirements became binding for U.S. banks.
Before 2015, excess capital—capital above all binding regulatory minimums—evolves in parallel for banks inside BHCs with nonbank subsidiaries and banks inside BHCs without them, albeit at different levels. Beginning in 2015, the two series diverge sharply: banks affiliated with nonbank subsidiaries accumulate substantially larger capital buffers, with the gap widening to 8–10 percentage points by 2020. At the consolidated holding company level, by contrast, no comparable divergence appears; excess capital for BHCs both with and without nonbank subsidiaries declines gradually as the new requirements phase in.
Excess Capital: Banks vs BHCs
Percent
Percent
Source: Authors' calculations using FR Y-9C, FR Y-9LP, and Call Reports.
Notes: The chart compares average excess bank and bank holding company (BHC) capital for BHCs with nonbank exposure and those without exposure. The left panel compares average excess bank capital from 2010-24 for BHCs with nonbank exposure to BHCs without nonbank exposure, based on 2005 exposure status, which ensures the classification is pre-determined relative to both the 2013:Q1 baseline used in regressions and the 2015:Q1 treatment date. The right panel presents the corresponding event-study estimates for excess BHC capital over the same period.
Banks become better capitalized; the organizations that own them do not. Where does the additional bank capital come from?
In our next post, we show that the answer lies inside the firm itself. Using historical variation in interstate banking deregulation to identify differences in organizational complexity, we trace how holding companies reallocated capital across subsidiaries after Basel III and show that much of the increase in bank capital came from the equity reservoirs inside the organization and not from outside investors.

Nicola Cetorelli is head of Financial Intermediation in the Federal Reserve Bank of New York’s Research and Statistics Group.
Shohini Kundu is an assistant professor of finance at the UCLA Anderson School of Management and an assistant professor of law (by courtesy) at the UCLA School of Law.
How to cite this post:
Nicola Cetorelli and Shohini Kundu, "Capitalizing on Nonbanks: Regulatory Arbitrage Within Bank Holding Companies," Federal Reserve Bank of New York Liberty Street Economics, July 15, 2026, https://doi.org/10.59576/lse.20260715
BibTeX: View |



Disclaimer
The views expressed in this post are those of the author(s) and do not necessarily reflect the position of the Federal Reserve Bank of New York or the Federal Reserve System. Any errors or omissions are the responsibility of the author(s).
 RSS Feed
 Follow Liberty Street Economics
