











This post concludes a three-part series on how bank regulation interacts with the organizational structure of banking firms. The first post documented the equity-rich nonbank subsidiaries inside bank holding companies (BHCs); the second post showed that BHCs met Basel III by reallocating capital internally, moving equity from nonbank affiliates to bank subsidiaries rather than raising new external capital. Here we ask what that reallocation meant for financial stability. The series draws on the authors’ recent Staff Report, “Regulatory Arbitrage Within the Firm.”
Banks became safer after Basel III. Whether it made the broader organization safer is less clear. We document that bank subsidiaries accumulated capital, improved asset quality, and reduced risk. But holding companies built that capital largely by drawing on their nonbank affiliates. Did the reallocation reduce risk for the organization as a whole or merely move it to a less visible part of the firm? Our evidence points to the latter: the same internal capital markets that helped banks meet tighter requirements left nonbank affiliates with thinner buffers and riskier business models, and a greater capacity to transmit distress back to the organizations that own them.
What Happened to the Banks?
On its own terms, capital regulation looks like a success. Banks become safer by nearly every conventional measure. Capital ratios rise, charge-offs fall, and asset quality improves. Just as important is what does not happen. A standard concern about higher capital requirements is that banks rebuild return on equity by taking on more risk; we find the opposite. Banks reduce risk-weighted assets relative to total assets and tilt their portfolios toward securities and cash, while leverage is essentially unchanged and the return on the marginal injected dollar of equity shows no effect. The additional capital is associated with stronger balance sheets and lower measured risk. Judged at the level of the bank alone, Basel III did exactly what it was designed to do.
What Happened to the Nonbanks?
The nonbank affiliates that supply capital to the banks move in the opposite direction. Event-study estimates show sharp breaks beginning in 2015:Q1, the same quarter Basel III’s requirements became binding for banks. Nonbank equity-to-asset ratios fall, dividends paid upstream to the parent rise, and net balances owed to parents and affiliated entities increase, as shown in the chart below.
Nonbank Event Study Around Basel III Implementation
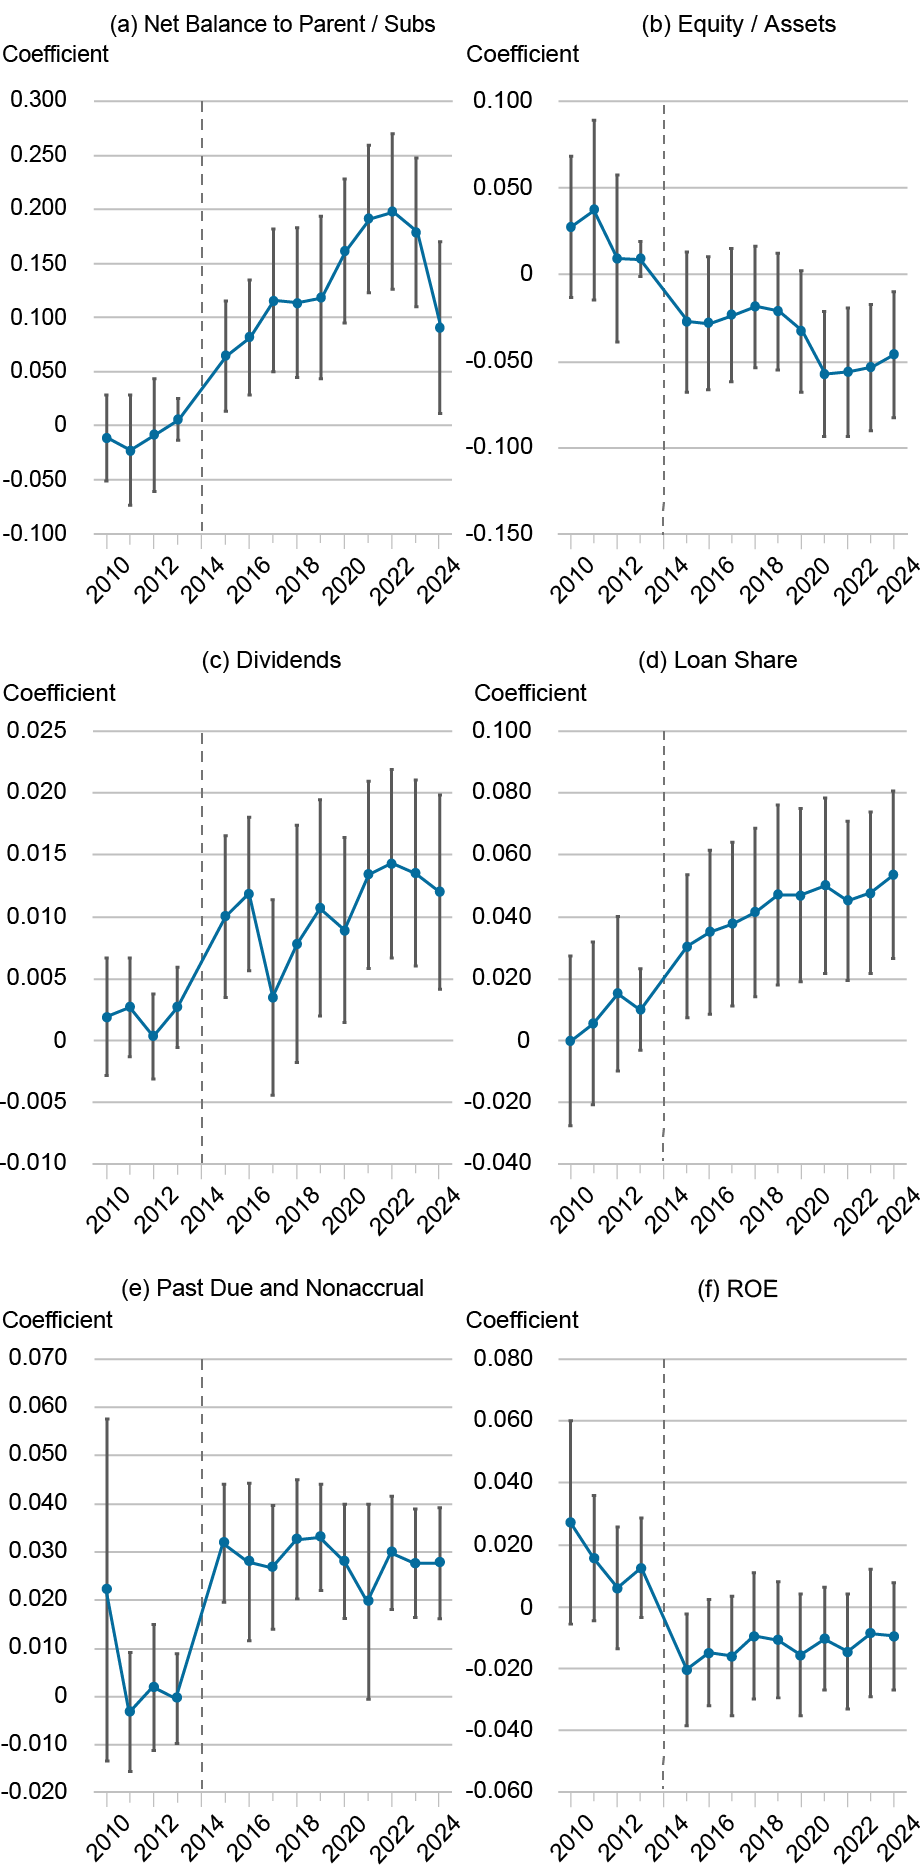
Notes: The chart presents event study estimates of nonbank outcomes relative to 2014 baseline. Panel (a) shows net balances to parent and other subsidiaries, Panel (b) shows equity-to-assets ratios, Panel (c) shows dividends/equity, Panel (d) shows loan shares, Panel (e) shows past-due and nonaccrual loans, and Panel (f) shows return on equity. Coefficients estimated from specification including nonbank subsidiary fixed effects, industry-quarter-year fixed effects, and BHC controls (top 200 BHC indicator, log assets, leverage, deposits/assets, asset growth, subsidiary count measured 2013:Q1) interacted with post-2015 indicator. Standard errors clustered at BHC level. Error bars indicate 90 percent confidence intervals.
These are not merely accounting adjustments. They accompany a substantial shift in what nonbanks do. As equity becomes scarcer, nonbanks retreat from equity-intensive activities such as trading, advisory services, and venture capital and expand into more leveraged lending, particularly consumer credit, even as lending at affiliated banks remains roughly flat. The organizational structure itself adapts. BHCs add nonbank lending subsidiaries and shed more capital-intensive insurance affiliates. Credit intermediation, in other words, migrates within the firm, from the regulated bank to less-regulated affiliates operating outside the traditional banking safety net.
The costs surface quickly. Delinquent loans and loss provisions rise, earnings become more volatile, and distance-to-default measures deteriorate. The subsidiaries that supply capital to the bank become materially more fragile.
Does Nonbank Fragility Reach the Bank?
None of this would matter for the bank if nonbank affiliates were fully ring-fenced. They are not, for two reasons.
First, even nominally implicit support is effectively nondiscretionary. Market participants treat parental backstops as credible commitments, and withdrawing support during distress would trigger the counterparty flight, funding disruptions, and rating downgrades that amplify losses for the entire organization. Rating agencies price it explicitly: major broker-dealer subsidiaries routinely receive credit ratings two to three notches above their parent holding companies, on the expectation that the parent would step in.
Second, banks and parents hold direct claims on their nonbank affiliates through loans, receivables, and committed funding lines that lose value when those affiliates weaken, regardless of any decision to recapitalize. The historical record offers repeated examples, from Citigroup’s reabsorption of off-balance-sheet vehicle assets in 2007‑08 to HSBC’s years of capital support for its subprime consumer-lending subsidiary, HSBC Finance, before beginning to wind the business down in 2009. The capital transferred into the bank, in short, is not insulated from problems on the nonbank side of the organization. Indeed, the reallocation itself replaces extracted equity with intra-family credit, enlarging the very claims through which distress can travel back, consistent with the rise in net balances to affiliates shown above.
To quantify this exposure, we conduct a series of stress tests using subsidiary-level balance sheets. We simulate losses ranging from 1 to 15 percent of nonbank assets and calculate how much capital a parent would need to inject to restore affected subsidiaries to plausible capitalization targets. Under our baseline scenario of a 5 percent loss on nonbank assets and a recapitalization target of 40 percent equity-to-assets, the average BHC would need to deploy roughly 18 percent of its excess capital to support its nonbank affiliates, as shown in the chart below. At the ninety-fifth percentile, recapitalization needs approach 100 percent of available excess capital, and more than 4 percent of BHCs would exhaust their buffers entirely. Under more severe scenarios, recapitalization needs exceed available capital for a meaningful share of institutions.
Nonbank Stress Tests: Recapitalization Needs and Buffer Exhaustion
Percent
Percent
Source: FR Y-11 and FR Y-9C.
Notes: The chart presents the nonbank stress test results. Left panel shows the percentage of BHC excess capital required for recapitalization. Blue line: mean across BHCs. Red line: 95th percentile (tail risk). Gold line at 100 percent indicates potential parent insolvency. Right panel shows percentage of BHCs with completely depleted capital buffers (recapitalization needs exceed available excess capital). Both panels assume nonbank subsidiaries target 40 percent capital ratio following asset shocks.
Once support costs are netted against the bank’s capital gain, the picture changes. How much depends on the share of the nonbank shortfall the parent covers, a parameter we do not estimate but vary from zero to full support. For the typical BHC, the gain survives at every level of support: recapitalization costs erode about 20 percent of the bank’s capital gain at partial support, and just under 40 percent even in the most conservative case of full support. For the most exposed institutions, the arithmetic inverts. At even partial support, costs consume more than 70 percent of the gain, and at full support these BHCs end up worse off than before the reallocation. That is, the cost of standing behind their nonbanks exceeds everything the bank gained. Banks became safer in part because risk-bearing capacity was transferred away from affiliated nonbanks. At the level of the consolidated organization, that transfer is not the same as a reduction in risk.
What This Means for Regulatory Design
The lesson of this series is that organizational structure shapes how regulation works. Basel III achieved its immediate objective: bank subsidiaries became better capitalized and less risky. But because capital requirements applied asymmetrically across subsidiaries within the same organization, they also activated an internal reallocation mechanism. Equity flowed from lightly regulated nonbanks to regulated banks, while lending activity and risk migrated in the opposite direction.
The familiar narrative holds that tighter bank regulation pushes activity from banks to nonbanks. Our findings suggest that much of this migration occurs within the boundaries of the same holding company, and that distinction matters, because the risk does not leave the organization. It remains connected to the bank through ownership, funding relationships, and implicit support commitments. Understanding financial stability therefore requires looking beyond the regulated bank itself to how capital and risk are distributed across the broader organization. In banking, as in many regulated industries, the boundaries of the firm help determine the ultimate effects of regulation.

Nicola Cetorelli is head of Financial Intermediation in the Federal Reserve Bank of New York’s Research and Statistics Group.
Shohini Kundu is an assistant professor of finance at the UCLA Anderson School of Management and an assistant professor of law (by courtesy) at the UCLA School of Law.
How to cite this post:
Nicola Cetorelli and Shohini Kundu, “Nonbank Subsidiaries and the Hidden Fragility of Internal Capital Markets Reallocation,” Federal Reserve Bank of New York Liberty Street Economics, July 17, 2026, https://doi.org/10.59576/lse.20260717
BibTeX: View |



Disclaimer
The views expressed in this post are those of the author(s) and do not necessarily reflect the position of the Federal Reserve Bank of New York or the Federal Reserve System. Any errors or omissions are the responsibility of the author(s).

 RSS Feed
 Follow Liberty Street Economics

This is a great article that exposes a critical blind spot in our current regulatory architecture. While asset reallocation can buffer distressed bank subsidiaries, it simultaneously introduces hidden vulnerabilities by masking risks within less-regulated nonbank entities.
As someone interested in financial regulation and systemic stability, I believe we must address these hidden internal capital flows before they trigger the next systemic crisis. The current regulatory framework often treats bank and nonbank subsidiaries as siloed entities, failing to capture how risk morphs and migrates across corporate boundaries. To build a truly resilient financial system, macroprudential supervision must evolve to treat the entire banking organization as a single, interconnected ecosystem where risk cannot be hidden in the shadows.