










In past work, we showed that trading in U.S. Treasury securities is becoming increasingly concentrated on the last trading day of each month. In this post, we show that trading is also becoming more concentrated around the designated pricing, or “strike,” times for fixed-income indexes. The concentration is especially pronounced on month-end trading days. We also document a marked shift in trading activity from around 3 p.m. (ET) to around 4 p.m. after a major fixed-income index provider moved its strike time from 3 p.m. to 4 p.m. in January 2021.
End-of-Month Trading, Index Rebalancing, and Index Strike Times
In an earlier LSE post, we found that overall Treasury security trading volume is about 58 percent higher on the last trading day of the month than on other days. We showed in a related post that this concentration of activity has increased sharply over the past decade or so and is associated with improved market liquidity. We conjecture that the increased concentration of activity may reflect the growth of assets managed relative to fixed-income indexes, many of which are rebalanced at month-end.
Unlike the equity market, the Treasury market is over-the-counter and has no exchange-mandated closing time. Instead, index providers have discretion as to what time of day to set their closing prices. Historically, 3 p.m. was the industry standard (among other reasons, open-outcry trading for Treasury futures ended at 3 p.m. and the 3 p.m. strike time allowed for a lead time before mutual funds’ net asset value production time of 4 p.m.). On January 14, 2021, Bloomberg Barclays—one of the largest providers of fixed-income indexes (and now called Bloomberg Fixed Income Indices)—changed the strike time for its U.S. dollar-denominated indexes from 3 p.m. to 4 p.m. Some reports suggest that one reason for the change was to reduce tracking error for funds that are required to price portfolios using 4 p.m. prices.
Empirical Approach
We measure the share of each day’s trading volume executed in the ten-minute windows around the 3 p.m. and 4 p.m. index strikes and track those shares over time. We do this for all days as a group and for end-of-month days when fixed-income indexes are rebalanced. We also compare intraday trading patterns before and after Bloomberg changed its strike time. Our analysis covers trading activity in the most recently auctioned (that is, on-the-run) notes and bonds in the interdealer market.
Trading Increasingly Concentrates at the Close
The chart below shows that the share of daily trading volume in the ten minutes around 3 p.m. increased from an average of 2.3 percent in 2016 to 3.4 percent in 2020. When Bloomberg’s strike time changed from 3 p.m. to 4 p.m. in January 2021, the share of activity around 3 p.m. plunged, and the share of activity around 4 p.m. (which had also been increasing from 2016 to 2020) surged. The share of activity around 4 p.m. has since increased from an average of 2.5 percent in 2021 to 3.5 percent in 2025.
Trading Now Concentrates Around the 4 P.M. Closing Strike
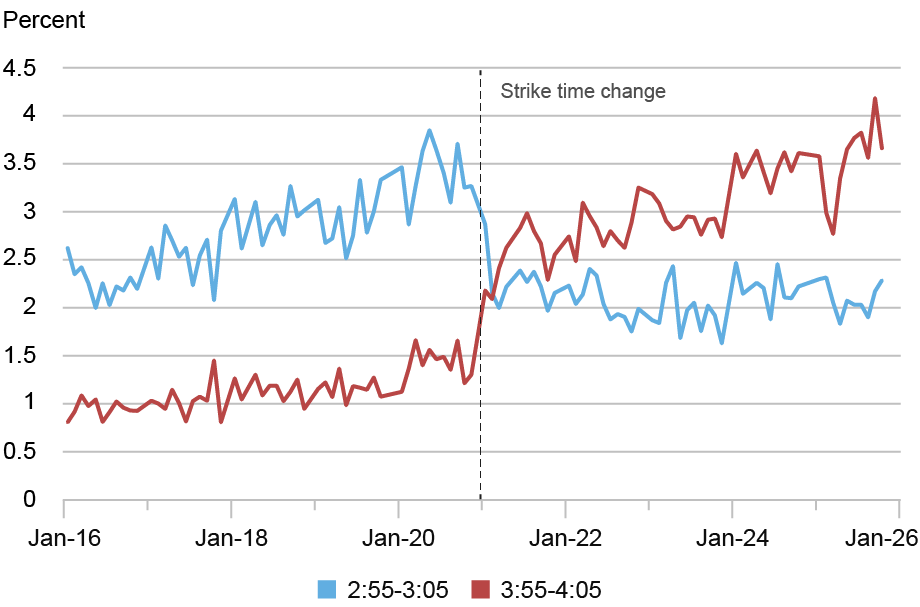
Note: The chart plots the average share of daily trading volume in the most recently auctioned Treasury notes and bonds from 2:55-3:05 p.m. and from 3:55-4:05 p.m. for each month from January 2016 to December 2025 (excluding days with an early market close and months in which the last trading day has an early close).
Effects More Pronounced on the Last Day of the Month
As shown in the next chart, trading volume is even more concentrated around the day-end strike times on the last trading day of each month, when indexes are rebalanced. The share of activity around 3 p.m. on such days increased from an average of 8.1 percent in 2016 to 12.1 percent in 2020. When Bloomberg’s strike time changed in January 2021, the share of activity around 3 p.m. plunged, and the share of activity around 4 p.m. (which had also been increasing from 2016 to 2020) surged. The share of activity around 4 p.m. has since increased from an average of 11.6 percent in 2021 to 20.4 percent in 2025.
End-of-Day Trading Is More Pronounced on the Last Day of the Month
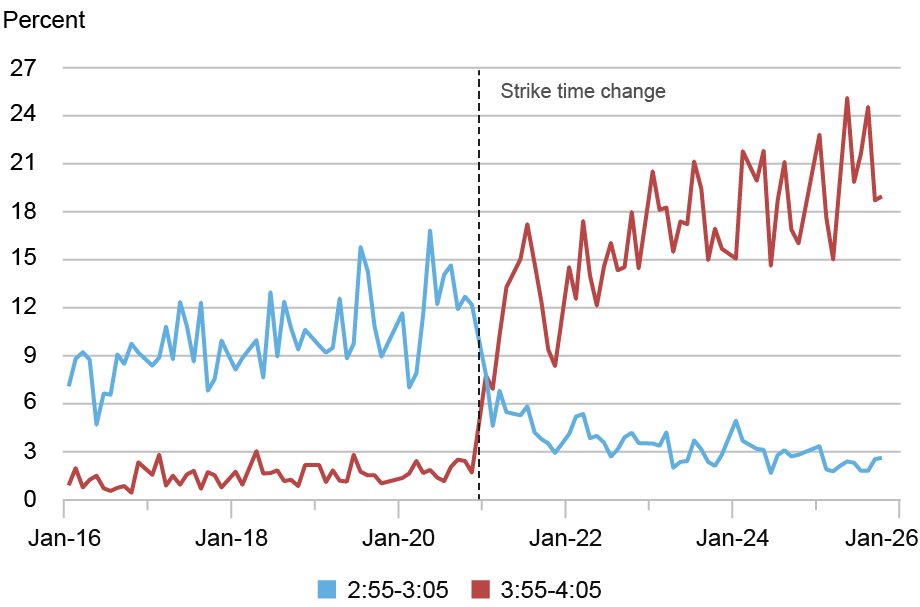
Note: The chart plots the share of daily trading volume in the most recently auctioned Treasury notes and bonds from 2:55-3:05 p.m. and from 3:55-4:05 p.m. on the last trading day of each month from January 2016 to December 2025 (excluding days with an early market close).
Effects Are Changing the Intraday Pattern of Activity
The increasing share of day-end trading and the increased importance of the 4 p.m. strike time are reflected in changes in the intraday pattern of trading activity. The next chart plots the average share of daily trading volume in each five-minute interval from 7 a.m. to 5:30 p.m. in 2016 and 2025. In 2016, trading volume spiked at the 8:30 and 10 a.m. release times of macroeconomic announcements, when auction results were released shortly after 1 p.m., and around the 3 p.m. strike time. There were much smaller spikes around 4 p.m. and 5 p.m.
Trading Activity Spikes at the Day-End Strike Times
Percent
Notes: The chart plots the average share of daily trading volume in the most recently auctioned Treasury notes and bonds for each five-minute interval from 7 a.m. to 5:30 p.m. in 2016 and 2025 (excluding days with an early market close). Gray bars denote overlap in shares between 2016 (blue) and 2025 (gold). Times indicate interval starting times.
In 2025, the pattern is mostly similar, but the 4 p.m. spike is much more pronounced. Interestingly, the 3 p.m. spike is of similar magnitude across the two years, but volume shares are then higher in 2025 for every interval from 3:10 p.m. to 5:05 p.m., and especially in the ten minutes around 4 p.m.
Our last chart compares the intraday patterns on month-end days in 2016 and 2025. We find much larger day-end spikes on these days, especially in 2025, consistent with our earlier results. The half-hour interval between 3:45 and 4:15 p.m. thus accounts for more than one quarter of total daily activity on month-end days in 2025, on average, with about half of that between 3:55 and 4:00 p.m. alone. These are unusually high trading volume days to begin with, as explained earlier.
End-of-Day Trading Activity Spikes Much More on the Last Day of the Month
Percent
Notes: The chart plots the average share of daily trading volume in the most recently auctioned Treasury notes and bonds for each five-minute interval from 7 a.m. to 5:30 p.m. on the last trading day of each month in 2016 and 2025 (excluding days with an early market close). Gray bars denote overlap in shares between 2016 (blue) and 2025 (gold). Times indicate interval starting times.
A general note about our intraday analysis is that there is round-the-clock trading in the market—as discussed in this article. We choose to plot the patterns for 7 a.m. – 5:30 p.m. only because such hours account for the overwhelming share of daily trading volume and because U.S. macroeconomic announcements and other important events (including U.S. Treasury auctions and end-of-day strike times) occur during these hours.
Summing Up
We find that trading activity in the U.S. Treasury market is increasingly concentrated around the end-of-day index strike times. This is especially true on the last trading day of each month when indexes are rebalanced, complementing our earlier findings of sharply increased trading on those days more generally. We further find a marked redistribution of trading activity from around 3 p.m. to around 4 p.m. when a major fixed-income index provider moved its strike time from 3 p.m. to 4 p.m. These results provide strong evidence that index pricing conventions materially shape when Treasury trading occurs.
Henry Dyer, a former research analyst in the Federal Reserve Bank of New York’s Research and Statistics Group, is pursuing a master’s in finance at the MIT Sloan School of Management.

Michael J. Fleming is head of Capital Markets in the Federal Reserve Bank of New York’s Research and Statistics Group.

Or Shachar is a financial research advisor in the Federal Reserve Bank of New York’s Research and Statistics Group.
How to cite this post:
Henry Dyer, Michael J. Fleming, and Or Shachar, “Treasury Trading at the Close,” Federal Reserve Bank of New York Liberty Street Economics, September 22, 2026, https://doi.org/10.59576/lse.20260922
BibTeX: View |



Disclaimer
The views expressed in this post are those of the author(s) and do not necessarily reflect the position of the Federal Reserve Bank of New York or the Federal Reserve System. Any errors or omissions are the responsibility of the author(s).
 You can follow this conversation by subscribing to the comment feed for this post.
 RSS Feed
 Follow Liberty Street Economics
