


24 posts on "Climate Change"
November 10, 2023
Potential Flood Map Inaccuracies in the Fed’s Second District
The National Flood Insurance Program (NFIP) flood maps, which designate areas at risk of flooding, are updated periodically through the Federal Emergency Management Agency (FEMA) and community efforts. Even so, many maps are several years old. As the previous two posts in the Extreme Weather series show, climate-related risks vary geographically. It is therefore important to produce accurate maps of such risks, like flooding. In this post we use detailed data on the flood risk faced by individual dwellings as well as digitized FEMA flood maps to tease out the degree to which flood maps in the Second District are inaccurate. Since inaccurate maps may leave households or banks exposed to the risk of uninsured flood damage, understanding map inaccuracies is key. We show that, when aggregated to the census tract level, a large number of maps do not fully capture flood risk. However, we are also able to show that updates do in fact improve map quality.
November 9, 2023
Transition Risks in the Fed’s Second District and the Nation
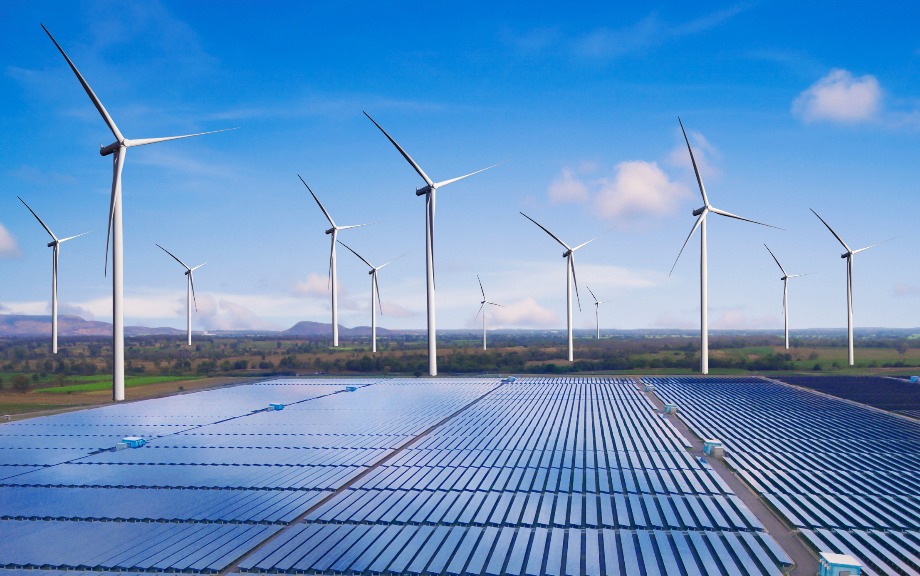
Climate change may pose two types of risk to the economy—from policies and consumer preferences as the energy system transitions to a lower dependence on carbon (in other words, transition risks) or from damages stemming from the direct impacts of climate change (physical risks). In this post, we follow up on our previous post that studied the exposure of the Federal Reserve’s Second District to physical risks by considering how transition risks affect different parts of the District and how they differentially affect the District relative to the nation. We find that, relative to other regions of the U.S., the economy of the Second District has considerably less exposure to fossil fuels. However, the cost of reducing even this relatively low economic dependence on carbon is still likely to be considerable.
Posted at 7:00 am in Climate Change, Employment, Inequality, New Jersey, New York, Regional Analysis | Permalink | Comments (1)
November 8, 2023
Comparing Physical Risk: The Fed’s Second District versus the Nation
In this post, we discuss the climate-related risks faced by the Federal Reserve’s Second District and compare these with risks faced by the nation as a whole. The comparison helps contextualize the risks while framing them in the broader context of a changing climate at the national level. We show that the continental Second District—an area consisting of New York State, the twelve northern-most counties of New Jersey, and Fairfield County in Connecticut—faces fewer and less severe climate-related physical risks than the nation as a whole. However, the areas that comprise the Second District still rank somewhat high in key risks that include “heat stress.” This holds true especially for New York City.
July 10, 2023
How Exposed Are U.S. Banks’ Loan Portfolios to Climate Transition Risks?
Much of the work on climate risk has focused on the physical effects of climate change, with less attention devoted to “transition risks” related to negative economic effects of enacting climate-related policies and phasing out high-emitting technologies. Further, most of the work in this area has measured transition risks using backward-looking metrics, such as carbon emissions, which does not allow us to compare how different policy options will affect the economy. In a recent Staff Report, we capitalize on a new measure to study the extent to which banks’ loan portfolios are exposed to specific climate transition policies. The results show that while banks’ exposures are meaningful, they are manageable.
April 20, 2023
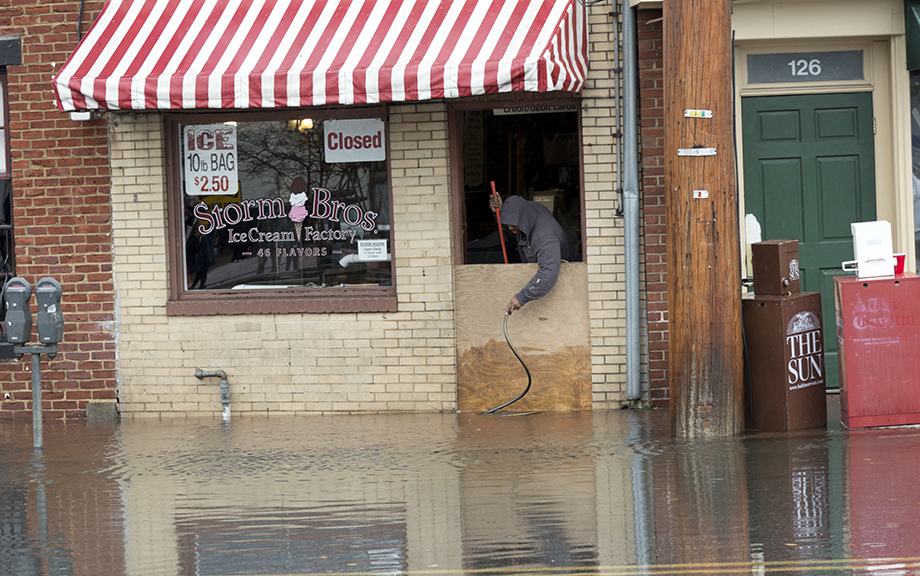
Moving Out of a Flood Zone? That May Be Risky!

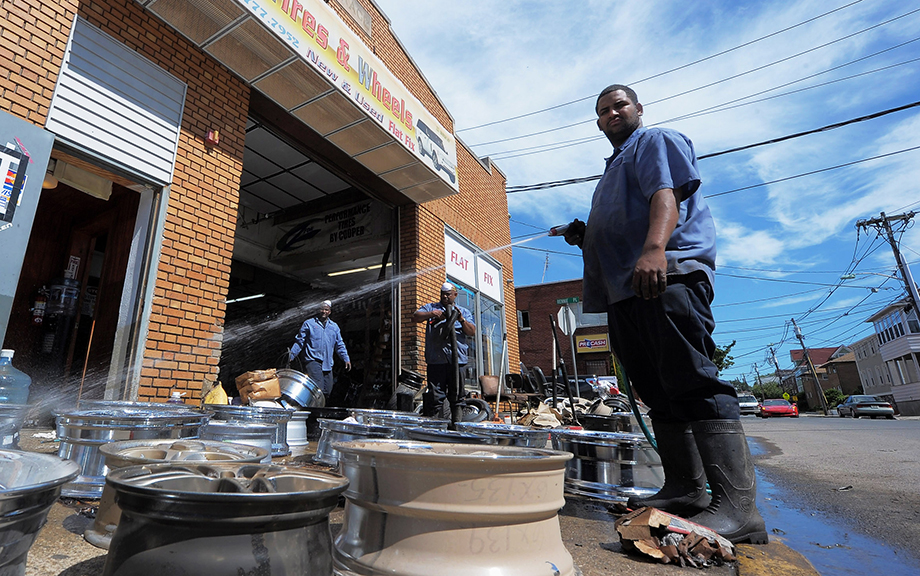
An often-overlooked aspect of flood-plain mapping is the fact that these maps designate stark boundaries, with households falling either inside or outside of areas designated as “flood zones.” Households inside flood zones must insure themselves against the possibility of disasters. However, costly insurance may have pushed lower-income households out of areas officially designated a flood risk and into physically adjacent areas. While not designated an official flood risk, Federal Emergency Management Agency (FEMA) and disaster data shows that these areas are still at considerable risk of flooding. In this post, we examine whether flood maps may have inadvertently clustered those households financially less able to bear the consequences of a disaster into areas that may still pose a significant flood risk.
CRISK: Measuring the Climate Risk Exposure of the Financial System
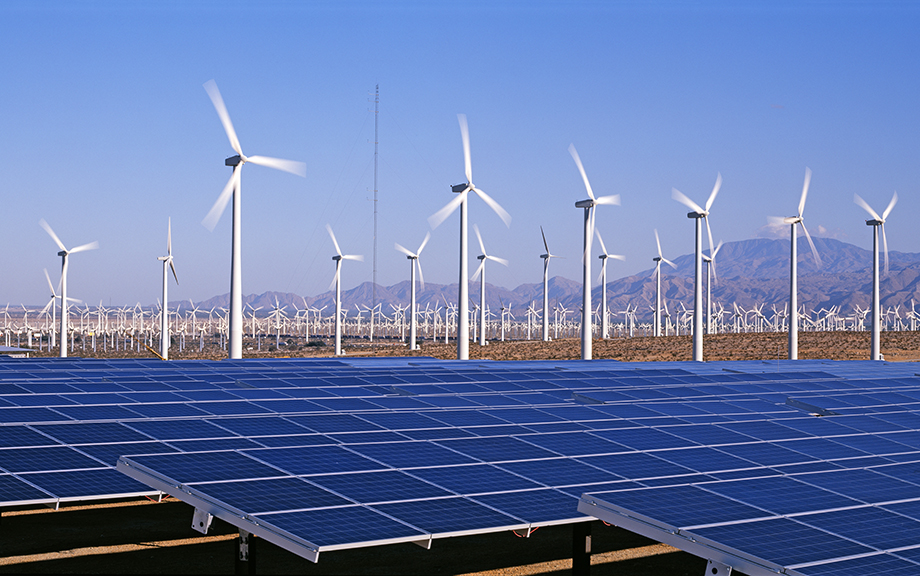
A growing number of climate-related policies have been adopted globally in the past thirty years (see chart below). The risk to economic activity from changes in policies in response to climate risks, such as carbon taxes and green subsidies, is often referred to as transition risk. Transition risk can adversely affect the real economy through […]
Posted at 7:00 am in Climate Change, Financial Institutions, Financial Markets, Systemic Risk | Permalink
February 14, 2023
Is the Green Transition Inflationary?

Are policies aimed at fighting climate change inflationary? In a new staff report we use a simple model to argue that this does not have to be the case. The model suggests that climate policies do not force a central bank to tolerate higher inflation but may generate a trade-off between inflation and employment objectives. The presence and size of this trade-off depends on how flexible prices are in the “dirty” and “green” sectors relative to the rest of the economy, and on whether climate policies consist of taxes or subsidies.
September 6, 2022
Small Business Recovery after Natural Disasters
The first post of this series found that small businesses owned by people of color are particularly vulnerable to natural disasters. In this post, we focus on the aftermath of disasters, and examine disparities in the ability of firms to reopen their businesses and access disaster relief. Our results indicate that Black-owned firms are more likely to remain closed for longer periods and face greater difficulties in obtaining the immediate relief needed to cope with a natural disaster.
How Do Natural Disasters Affect U.S. Small Business Owners?
Recent research has linked climate change and socioeconomic inequality (see here, here, and here). But what are the effects of climate change on small businesses, particularly those owned by people of color, which tend to be more resource-constrained and less resilient? In a series of two posts, we use the Federal Reserve’s Small Business Credit Survey (SBCS) to document small businesses’ experiences with natural disasters and how these experiences differ based on the race and ethnicity of business owners. This first post shows that small firms owned by people of color sustain losses from natural disasters at a disproportionately higher rate than other small businesses, and that these losses make up a larger portion of their total revenues. In the second post, we explore the ability of small firms to reopen and to obtain disaster relief funding in the aftermath of climate events.
July 7, 2022
Climate Change: Implications for Macroeconomics
What are the implications of climate change, and climate change–related policies, for macroeconomics in general and monetary policy in particular? This is the key question debated at a recent symposium on “Climate Change: Implications for Macroeconomics” organized by the Applied Macroeconomics and Econometrics Center (AMEC) of the New York Fed on May 13. This post briefly summarizes the content of the discussion and provides links to recordings of the various sessions and the participants’ slides.
 RSS Feed
 Follow Liberty Street Economics