


The Federal Reserve Bank of New York’s Center for Microeconomic Data today released its Quarterly Report on Household Debt and Credit for the second quarter of 2021. It showed that overall household debt increased at a quick clip over the period, with a $322 billion increase in balances, boosted primarily by a 2.8 percent increase in mortgage balances, a 2.2 percent increase in credit card balances, and a 2.4 percent increase in auto balances. Mortgage balances in particular were boosted by a record $1.22 trillion in newly originated loans. Although some borrowers are originating new loans, struggling borrowers remain in forbearance programs, where they are pausing repayment on their debts and creating an additional upward pressure on outstanding mortgage balances.
This analysis, as well as the Quarterly Report on Household Debt and Credit are based on the New York Fed’s Consumer Credit Panel (CCP), a 5 percent representative sample of consumer credit reports from Equifax, which we have used for monitoring the health of the household balance sheet and the uptake of forbearance since the arrival of the pandemic. While pandemic related mortgage forbearances were declining over time, thanks to a recovery of economic activity and stimulus payments, there were some increases in inflows to mortgage forbearance not directly related to the pandemic.
When the state of Texas and some neighboring states were hit with severe weather in winter of 2021, almost 70 percent of borrowers lost power, and many borrowers experienced damage to their properties, producing additional mortgage forbearances. Texas is a big state, enough to produce fluctuations in the forbearance rate for the United States overall. Thus, in the chart below, we break out these effects separately, we exploit the richness in our forbearance data to break out these effects separately. We observe that there has been a steady outflow of borrowers in forbearance as the pandemic has begun to wane, with just 2.7 percent of mortgages still in forbearance at the end of June 2021 (when we include storm-related forbearances, the national rate is 3.3 percent).
Forbearance participation, entry, and exit
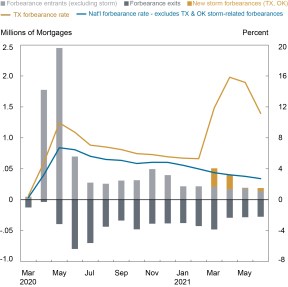
Source: New York Fed Consumer Credit Panel / Equifax.
In the map below, we look at the forbearance participation rates of all states, beyond Texas. Texas and Oklahoma rank the highest, both having been affected by the storms: it is unlikely that this reflects forbearances associated with the CARES Act and more likely are weather related. The map reveals substantial geographic differences in the participation in pandemic mortgage forbearance programs, with states in the Southeast having the highest lingering forbearance rate, excepting the Carolinas. This dispersion likely captures a combination of the severity of the pandemic’s local economic impact and differences in the borrowers’ awareness, interest in, and access to these programs.
Percent of Mortgages in Forbearance by State, June-2021
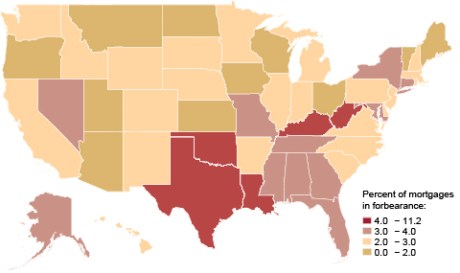
Source: New York Fed Consumer Credit Panel / Equifax.
Finally, we look at the composition of borrowers who remain in forbearance. During the course of the past fifteen months, 9.3 million mortgages were in forbearance at some point. However, only 21 percent of those mortgages, or just under 2 million, remained in forbearance as of the end of June 2021. As we described in our series in May (see Related Reading below), the remaining pool of forborne borrowers has a notably lower average credit score compared to participants a year ago. The chart below examines the pool of mortgages in forbearance by the borrowers pre-pandemic credit score. A year ago, 32 percent of mortgages in forbearance were associated with prime borrowers with credit scores of 760 or higher. But the composition has shifted, and that share has shrunk to 25 percent, with 39 percent of the remaining mortgages in forbearance held by borrowers with credit scores under 620. This is especially remarkable when we consider the overall pool of mortgages skews much more toward the prime–only 18 percent of mortgages outstanding are associated with subprime borrowers.
We find similar, although less pronounced, results when we look at the same share broken out instead by the borrowers’ neighborhood income. Although we do not directly observe income on credit reports, we are able to group our borrowers using the average income of their zip code using data from the IRS Statistics of Income. Mortgages held by borrowers living in the lowest income neighborhoods, comprise only 16 percent of the pool of outstanding mortgages but were 21 percent of the mortgages in forbearance at the end of June. This is consistent with the finding that uptake of mortgage forbearance is correlated with the mortgage origination credit score.
Subprime Borrowers Are Much More Likely to Be In Forbearance, and More Likely to Remain
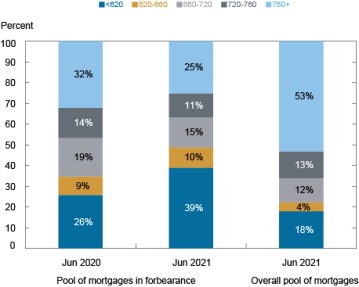
Source: New York Fed Consumer Credit Panel / Equifax.
Looking forward, those borrowers remaining in forbearance are the borrowers that will be most likely to struggle when these policies are lifted. Federally backed mortgages are eligible for up to eighteen months of forbearance, depending on when the initial forbearances started. With this limit in effect, many of the borrowers remaining in forbearance will face the limits of this leniency in the coming 3-4 months, when they must either resume payment or will be pressured to sell their homes to avoid delinquencies and consequent foreclosures. It appears that the CARES Act and other policy supports to households has been largely successful at avoiding widespread damage to household balance sheets, with little evidence of increasing delinquency in our Quarterly Report. It is unclear, however, how the unwinding of these programs in a still recovering economy will impact mortgage borrowers across different income and credit score groups and geographic locations.
Chart data ![]()

Andrew Haughwout is a senior vice president in the Federal Reserve Bank of New York’s Research and Statistics Group.

Donghoon Lee is an officer in the Bank’s Research and Statistics Group.

Joelle Scally is a senior data strategist in the Bank’s Research and Statistics Group.

Wilbert van der Klaauw is a senior vice president in the Bank’s Research and Statistics Group.
How to cite this post:
Andrew F. Haughwout, Donghoon Lee, Joelle Scally, and Wilbert van der Klaauw, “Forbearance Participation Declines as Programs’ End Nears,” Federal Reserve Bank of New York Liberty Street Economics, August 3, 2021, https://libertystreeteconomics.newyorkfed.org/2021/08/forbearance-participation-declines-as-programs-end-nears/
Related Reading
Keeping Borrowers Current in a Pandemic
What Happens during Mortgage Forbearance?
Small Business Owners Turn to Personal Credit
What’s Next for Forborne Borrowers?
Disclaimer
The views expressed in this post are those of the authors and do not necessarily reflect the position of the Federal Reserve Bank of New York or the Federal Reserve System. Any errors or omissions are the responsibility of the authors.
 RSS Feed
 Follow Liberty Street Economics