Credit, Income, and Inequality
Access to credit plays a central role in shaping economic opportunities of households and businesses. Access to credit also plays a crucial role in helping an economy successfully exit from the pandemic doldrums. The ability to get a loan may allow individuals to purchase a home, invest in education and training, or start and then expand a business. Hence access to credit has important implications for upward mobility and potentially also for inequality. Adverse selection and moral hazard problems due to asymmetric information between lenders and borrowers affect credit availability. Because of these information issues, lenders may limit credit or post higher lending rates and often require borrowers to pledge collateral. Consequently, relatively poor individuals with limited capital endowment may experience credit denial, irrespective of the quality of their investment ideas. As a result, their exclusion from credit access can hinder economic mobility and entrench income inequality. In this post, we describe the results of our recent paper which contributes to the understanding of this mechanism.
What Happens during Mortgage Forbearance?
As we discussed in our previous post, millions of mortgage borrowers have entered forbearance since the beginning of the pandemic, and over 2 million remain in a program as of March 2021. In this post, we use our Consumer Credit Panel (CCP) data to examine borrower behavior while in forbearance. The credit bureau data are ideal for this purpose because they allow us to follow borrowers over time, and to connect developments on the mortgage with those on other credit products. We find that forbearance results in reduced mortgage delinquencies and is associated with increased paydown of other debts, suggesting that these programs have significantly improved the financial positions of the borrowers who received them.
Who’s Ready to Spend? Constrained Consumption across the Income Distribution
Spending on goods and services that were constrained during the pandemic is expected to grow at a fast pace as the economy reopens. In this post, we look at detailed spending data to track which consumption categories were the most constrained by the pandemic due to social distancing. We find that, in 2019, high-income households typically spent relatively more on these pandemic-constrained goods and services. Our findings suggest that these consumers may have strongly reduced consumption during the pandemic and will likely play a crucial role in unleashing pent-up demand when pandemic restrictions ease.
Credit Card Balance Declines Are Largest Among Older, Wealthier Borrowers

Total household debt rose by $85 billion in the first quarter of 2021, according to the latest Quarterly Report on Household Debt and Credit from the New York Fed’s Center for Microeconomic Data. Since the start of the pandemic, household debt balances have increased in every quarter but one—the second quarter of 2020, when lockdowns were in full effect. The Quarterly Report and this analysis are based on the New York Fed’s Consumer Credit Panel, which is based on Equifax credit data.
How COVID‑19 Affected First‑Time Homebuyers

Efforts in the spring of 2020 to contain the spread of COVID-19 resulted in a sharp contraction in U.S. economic growth and an unprecedented, rapid rise in unemployment. While the first wave of the pandemic slowed the spring housing market, home sales rebounded sharply over the rest of the year, with strong gains in house prices. Given the rising house prices and continuing high unemployment, concerns arose that COVID-19 may have negatively affected first-time homebuyers. Using a new and more accurate measure of first-time homebuyers, we find that these buyers have not been adversely affected by the pandemic. At the same time, gains from lower mortgage rates have gone to existing homeowners and not to households purchasing their first home.
An Update on How Households Are Using Stimulus Checks
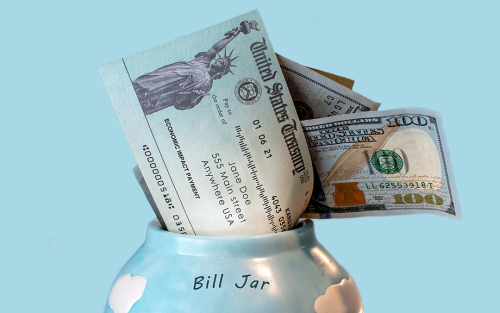
In October, we reported on how households used their first economic impact payments, which they started to receive in mid-April 2020 as part of the CARES Act, and how they expected to use a second stimulus payment. In this post, we exploit new survey data to examine how households used the second round of stimulus checks, abd we investigate how they plan to use the third round.
Do People View Housing as a Good Investment and Why?

Housing represents the largest asset owned by most households and is a major means of wealth accumulation, particularly for the middle class. Yet there is limited understanding of how households view housing as an investment relative to financial assets, in part because of their differences beyond the usual risk and return trade-off. Housing offers households an accessible source of leverage and a commitment device for saving through an amortization schedule. For an owner-occupied residence, it also provides stability and hedges for rising housing costs. On the other hand, housing is much less liquid than financial assets and it also requires more time to manage. In this post, we use data from our just released SCE Housing Survey to answer several questions about how households view this choice: Do households view housing as a good investment choice in comparison to financial assets, such as stocks? Are there cross-sectional differences in preferences for housing as an investment? What are the factors households consider when making an investment choice between housing and financial assets?
“Excess Savings” Are Not Excessive

How will the U.S. economy emerge from the ongoing COVID-19 pandemic? Will it struggle to return to prior levels of employment and activity, or will it come roaring back as soon as vaccinations are widespread and Americans feel comfortable travelling and eating out? Part of the answer to these questions hinges on what will happen to the large amount of “excess savings” that U.S. households have accumulated since last March. According to most estimates, these savings are around $1.6 trillion and counting. Some economists have expressed the concern that, if a considerable fraction of these accumulated funds is spent as soon as the economy re-opens, the ensuing rush of demand might be destabilizing. This post argues that these savings are not that excessive, when considered against the backdrop of the unprecedented government interventions adopted over the past year in support of households and that they are unlikely to generate a surge in demand post-pandemic.


 RSS Feed
 Follow Liberty Street Economics