


102 posts on "Inequality"
February 7, 2024
Racial and Ethnic Wealth Inequality in the Post‑Pandemic Era
Editor’s note: Since this post was first published, the authors updated their analysis to focus on the household level of wealth rather than the aggregate level. Please refer to the new blog post and findings here Racial and Ethnic Inequalities in Household Wealth Persist. (June 28, @ 7:19am)
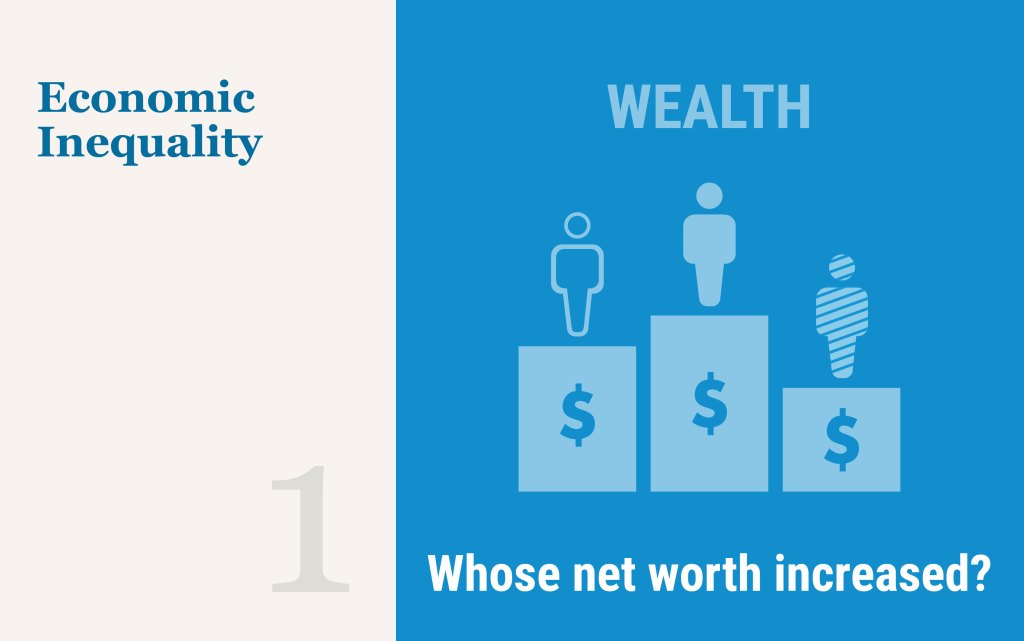
Wealth is unevenly distributed across racial and ethnic groups in the United States. In this first post in a two-part series on wealth inequality, we use the Distributional Financial Accounts (DFA) to document these disparities between Black, Hispanic, and white households from the first quarter of 2019 to the third quarter of 2023 for wealth and a variety of asset and liability categories. We find that these disparities have been exacerbated since the pandemic, likely due to rapid growth in the financial assets more often held by white individuals.
Posted at 10:00 am in Demographics, Financial Markets, Inequality, Pandemic | Permalink | Comments (2)
January 10, 2024
An Overlooked Factor in Banks’ Lending to Minorities
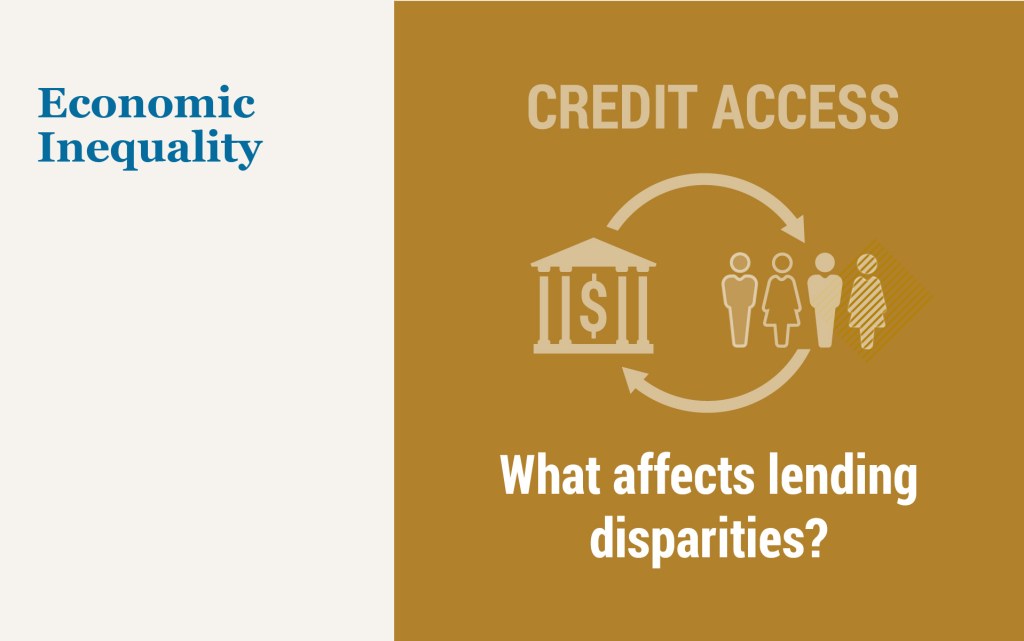
In the second quarter of 2022, the homeownership rate for white households was 75 percent, compared to 45 percent for Black households and 48 percent for Hispanic households. One reason for these differences, virtually unchanged in the last few decades, is uneven access to credit. Studies have documented that minorities are more likely to be denied credit, pay higher rates, be charged higher fees, and face longer turnaround times compared to similar non-minority borrowers. In this post, which is based on a related Staff Report, we show that banks vary substantially in their lending to minorities, and we document an overlooked factor in this difference—the inequality aversion of banks’ stakeholders.
January 8, 2024
Measuring Price Inflation and Growth in Economic Well‑Being with Income‑Dependent Preferences

How can we accurately measure changes in living standards over time in the presence of price inflation? In this post, I discuss a novel and simple methodology that uses the cross-sectional relationship between income and household-level inflation to construct accurate measures of changes in living standards that account for the dependence of consumption preferences on income. Applying this method to data from the U.S. suggests potentially substantial mismeasurements in our available proxies of average growth in consumer welfare in the U.S.
December 1, 2023
Recent Disparities in Earnings and Employment

The New York Fed recently released its latest set of Equitable Growth Indicators (EGIs). Updated quarterly, the EGIs continue to report demographic and geographic differences in inflation, earnings (real and nominal), employment, and consumer spending (real and nominal) at the national level. This release also launches a set of national wealth EGIs (which will be examined more closely on Liberty Street Economics early next year). Going forward, EGI releases will also include a set of regional EGIs, which will present disparities in inflation, earnings (real and nominal), employment, and consumer spending (real and nominal) in our region. Drawing on the just released EGIs, in this post, we present recent gender gaps in the labor market at the national and regional levels. We provide a picture of how gender wage and employment disparities have evolved since the pandemic, examining and contrasting gaps at the national and regional level. We find that the gaps between the employment rates and earnings of men and women have declined steadily following the pandemic, but have declined perceptibly more so in our region than in the nation.
Posted at 7:00 am in Demographics, Inequality, New Jersey, New York, Regional Analysis, Unemployment | Permalink
November 17, 2023
Flood‑Prone Basement Housing in New York City and the Impact on Low‑ and Moderate‑Income Renters
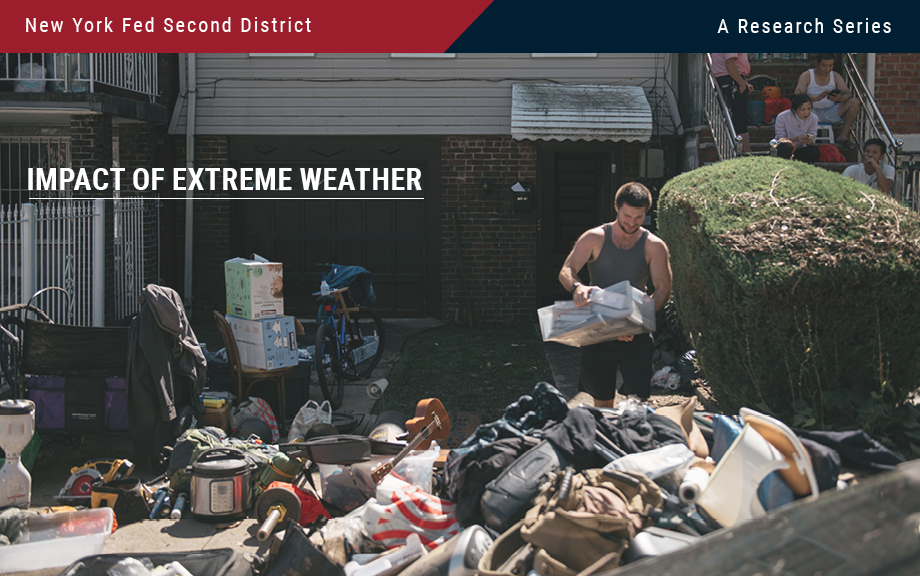
Hurricane Ida, which struck New York in early September 2021, exposed the region’s vulnerability to extreme rainfall and inland flooding. The storm created massive damage to the housing stock, particularly low-lying units. This post measures the storm’s impact on basement housing stock and, following the focus on more-at-risk populations from the two previous entries in this series, analyzes the attendant impact on low-income and immigrant populations. We find that basements in select census tracts are at high risk of flooding, affecting an estimated 10 percent of low-income and immigrant New Yorkers.
November 16, 2023
Small Business Recovery after Natural Disasters in the Fed’s Second District
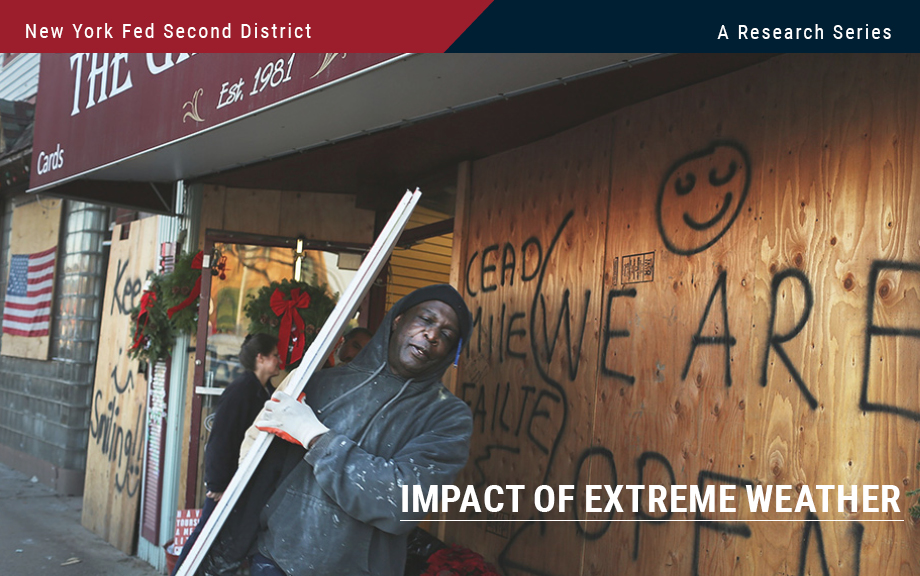
A previous Liberty Street Economics post found that minority-owned small businesses in the Federal Reserve’s Second District have been particularly vulnerable to natural disasters. Here we focus on the aftermath of disasters (such as hurricanes, floods, wildfires, droughts, and winter storms) and examine disparities in the ability of these firms to reopen their businesses and access disaster relief. Our results indicate that while white- and minority-owned firms remain closed for similar durations, the latter are more reliant on external funding from government and private sources to cope with disaster losses.
November 9, 2023
Transition Risks in the Fed’s Second District and the Nation
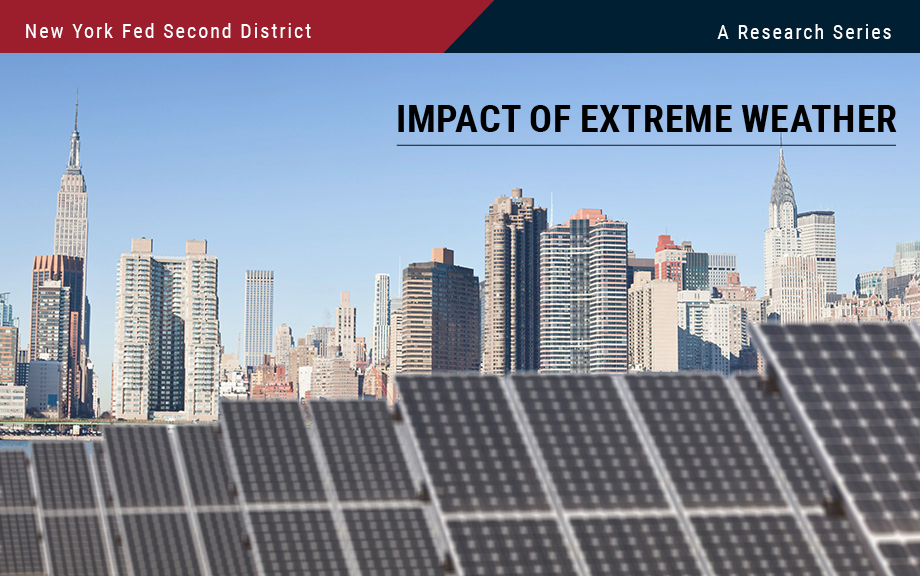
Climate change may pose two types of risk to the economy—from policies and consumer preferences as the energy system transitions to a lower dependence on carbon (in other words, transition risks) or from damages stemming from the direct impacts of climate change (physical risks). In this post, we follow up on our previous post that studied the exposure of the Federal Reserve’s Second District to physical risks by considering how transition risks affect different parts of the District and how they differentially affect the District relative to the nation. We find that, relative to other regions of the U.S., the economy of the Second District has considerably less exposure to fossil fuels. However, the cost of reducing even this relatively low economic dependence on carbon is still likely to be considerable.
Posted at 7:00 am in Climate Change, Employment, Inequality, New Jersey, New York, Regional Analysis | Permalink | Comments (1)
October 16, 2023
Racial Discrimination in Child Protective Services
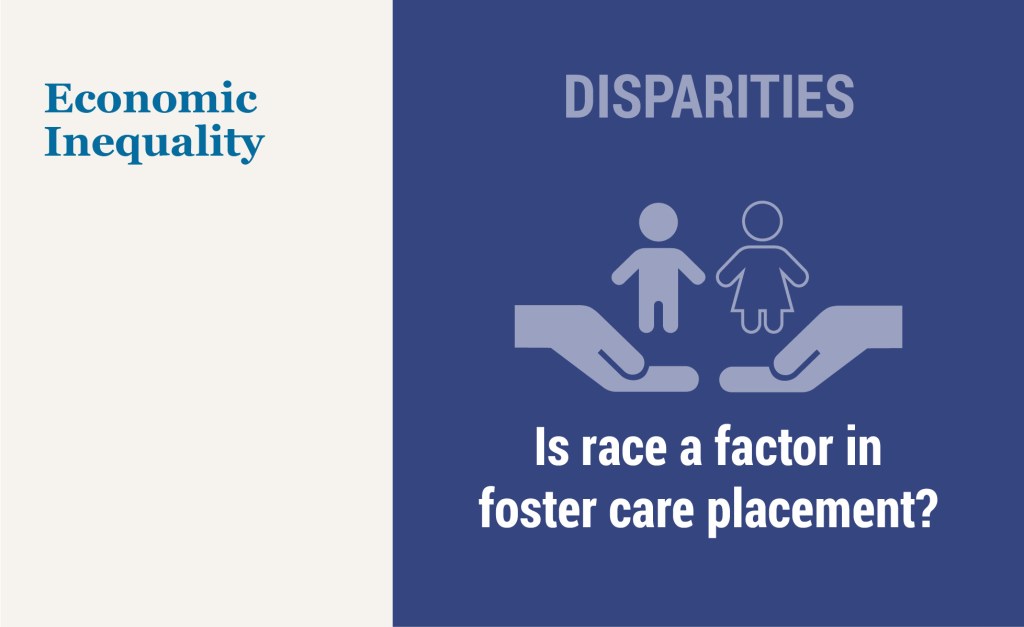
Childhood experiences have an enormous impact on children’s long-term societal contributions. Experiencing childhood maltreatment is associated with compromised physical and mental health, decreased educational attainment and future earnings, and increased criminal activity. Child protective services is the government’s way of endeavoring to protect children. Foster care consequently has large potential effects on a child’s future education, earnings, and criminal activity. In this post, we draw on a recent study to document disparities in the likelihood that children of different races will be placed into foster care.
October 5, 2023
Does Income Inequality Affect Small Firms?
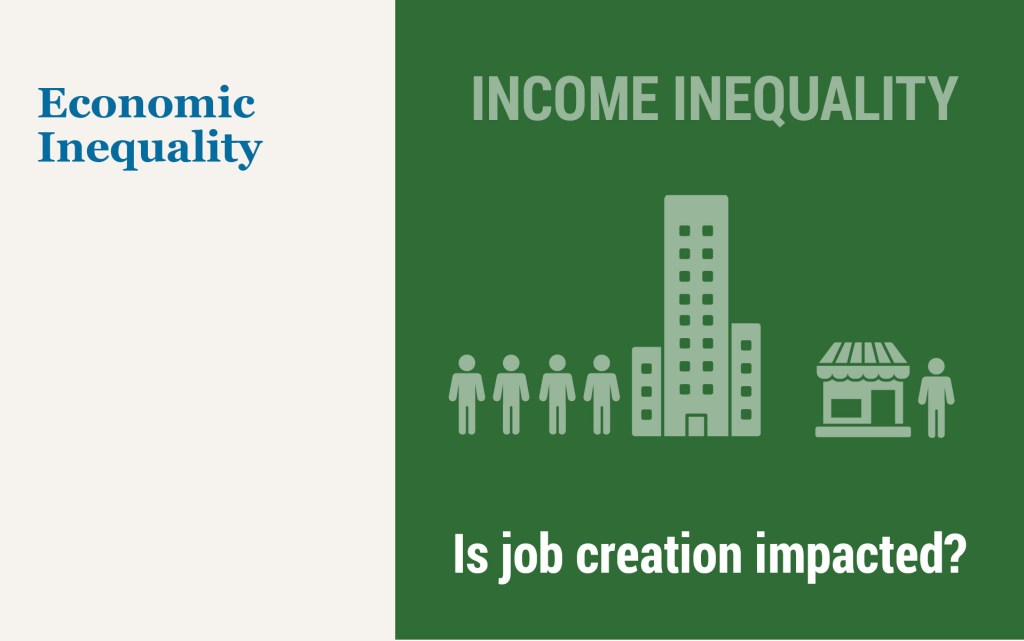
The share of income going to high-income households has increased significantly in the United States in recent decades. In 1980, the average income share of earners in the top 10 percent was around 30 percent. However, by 2015, it had surpassed 45 percent. The employment share of small firms has also declined, with a decrease of approximately 5 percentage points over the same period. In this post, we use variation across states to show a correlation between these two developments, with states having the greatest increase in the upper income share also tending to be those with the biggest job creation declines in small firms compared to large firms. One explanation for this correlation is that the increase in the income share of the highest income earners reduced deposits in small and medium-size banks from what they otherwise would have been. In doing so, this shift in income reduced the available credit for small firms, putting them at a disadvantage relative to large firms.
June 1, 2023
What Drove Racial Disparities in the Paycheck Protection Program?

Numerous studies of the Paycheck Protection Program (PPP), which provided loans to small businesses during the COVID-19 pandemic, have documented racial disparities in the program. Because publicly available PPP data only include information on approved loans, prior work has largely been unable to assess whether these disparities were driven by borrower application behavior or by lender approval decisions. In this post, which is based on a related Staff Report and NBER working paper, we use the Federal Reserve’s 2020 Small Business Credit Survey to examine PPP application behavior and approval decisions and to study the strengths and limitations of fintech lenders in enhancing access to credit for Black-owned businesses.
 RSS Feed
 Follow Liberty Street Economics