The Coronavirus Shock Looks More like a Natural Disaster than a Cyclical Downturn
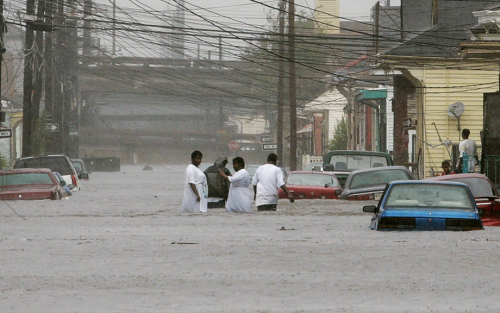
It’s tempting to compare the economic fallout from the coronavirus pandemic to prior business cycle downturns, particularly the Great Recession. However, such comparisons may not be particularly apt—as evidenced by the unprecedented surge in initial jobless claims over the past three weeks. Recessions typically develop gradually over time, reflecting underlying economic and financial conditions, whereas the current economic situation developed suddenly as a consequence of a fast-moving global pandemic. A more appropriate comparison would be to a regional economy suffering the effects of a severe natural disaster, like Louisiana after Hurricane Katrina or Puerto Rico after Hurricane Maria. To illustrate this point, we track the recent path of unemployment claims in the United States, finding a much closer match with Louisiana after Katrina than the U.S. economy following the Great Recession.
Businesses in the Tri‑State Region Struggling to Weather the Coronavirus Outbreak
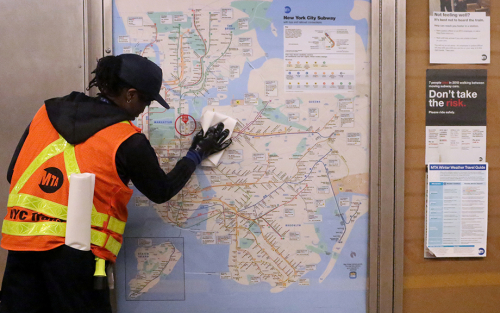
As a result of the coronavirus outbreak, New York State, New Jersey, and Connecticut have closed nonessential businesses and schools and asked residents to stay home in an effort to slow the spread of the virus. These actions are unprecedented, and the economic impacts are likely to be temporary but severe, and difficult to track and measure. With conditions changing so rapidly, timely data on the economic impacts of the outbreak and resultant policies on businesses and people are both scarce and important. In this post, we provide some very recent information on the economic effects of the coronavirus outbreak in the New York-Northern New Jersey region based on responses to a special survey we fielded between March 20 and March 24. The results are striking, though perhaps not surprising: roughly half of the service firms surveyed and well over a third of manufacturers said they have already implemented at least a partial temporary shutdown, and more firms plan to do so in the near future. Further, 40 percent of service firms and 30 percent of manufacturers are reporting staff reductions, and many firms are noting difficulty accessing credit and are concerned about their solvency.
Growth Has Slowed across the Region
At today’s regional economic press briefing, we highlighted some recent softening in the tri-state regional economy (New York, Northern New Jersey, and Fairfield County, Connecticut)—a noteworthy contrast from our briefing a year ago, when economic growth and job creation were fairly brisk. We also showed that Puerto Rico and the U.S. Virgin Islands, which are part of the New York Fed’s district, both continue to face major challenges but have made significant economic progress following the catastrophic hurricanes of 2017.
Some Places Are Much More Unequal than Others
Economic inequality in the United States is much more pronounced in some parts of the country than others. In this post, we examine the geography of wage inequality, drawing on our recent Economic Policy Review article. We find that the most unequal places tend to be large urban areas with strong economies where wage growth has been particularly strong for those at the top of the wage distribution.
Introduction to Heterogeneity Series: Understanding Causes and Implications of Various Inequalities
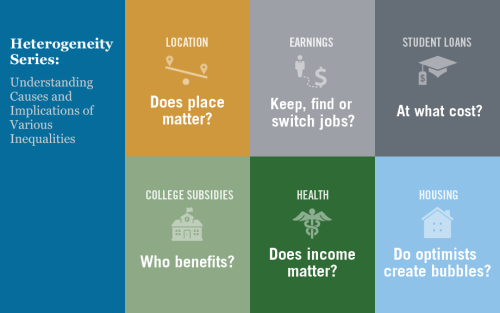
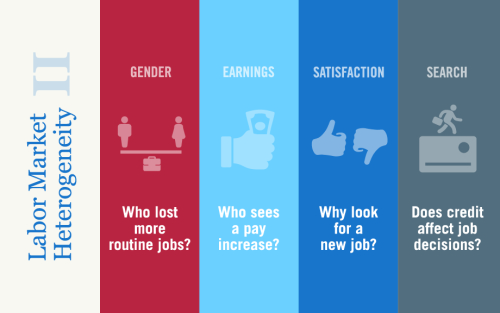
Economic analysis is often geared toward understanding the average effects of a given policy or program. Likewise, economic policies frequently target the average person or firm. While averages are undoubtedly useful reference points for researchers and policymakers, they don’t tell the whole story: it is vital to understand how the effects of economic trends and government policies vary across geographic, demographic, and socioeconomic boundaries. It is also important to assess the underlying causes of the various inequalities we observe around us, be they related to income, health, or any other set of indicators. Starting today, we are running a series of six blog posts (apart from this introductory post), each of which focuses on an interesting case of heterogeneity in the United States today.
U.S. Virgin Islands Struggle While Puerto Rico Rebounds

Almost two years after hurricanes Irma and Maria wreaked havoc on Puerto Rico and the U.S. Virgin Islands, the two territories’ economies have moved in very different directions. When the hurricanes struck, both were already in long economic slumps and had significant fiscal problems. As of mid-2019, however, Puerto Rico’s economy was showing considerable signs of improvement since the hurricanes, while the Virgin Islands’ economy remained mired in a deep slump through the end of 2018, though signs of a nascent recovery began emerging in early 2019. In this post, we assess the contrasting trends of these two economies since the hurricanes and attempt to explain the forces driving these trends.
Minimum Wage Impacts along the New York‑Pennsylvania Border
Just Released: New Regional Employment Data Now Available

Regional employment data provided by the U.S. Bureau of Labor Statistics (BLS) are a critically important tool used to track and assess local economic conditions on a timely basis. However, the primary data used for this purpose are monthly survey-based estimates that are revised once per year, and these revisions can sometimes be substantial and surprising. As a result, initial readings of these data can lead to conclusions about employment trends that may later change. It is possible to anticipate these revisions in advance of their release using a second publicly available data set released by the BLS. Like some of our colleagues at other Federal Reserve Banks, the Federal Reserve Bank of New York is now performing an “early benchmark” of initial monthly employment releases throughout the year and making these benchmarked data available to the public on a monthly basis. Our early benchmarked estimates tend to more closely track revised data than the initial releases do, and can help policymakers and the public better monitor regional economic conditions on a timely basis.
Just Released: The New York Fed’s New Regional Economy Website
Jaison R. Abel, Jason Bram, Richard Deitz, and Jonathan Hastings The New York Fed today unveiled a newly designed website on the regional economy that offers convenient access to a wide array of regional data, analysis, and research that the Bank makes available to the public. Focusing specifically on the Federal Reserve’s Second District, which […]



 RSS Feed
 Follow Liberty Street Economics