Reserves and Where to Find Them

Banks use central bank reserves for a multitude of purposes including making payments, managing intraday liquidity outflows, and meeting regulatory and internal liquidity requirements. Data on aggregate reserves for the U.S. banking system are readily accessible, but information on the holdings of individual banks is confidential. This makes it difficult to investigate important questions like: “Which types of banks hold reserves?” “How concentrated are they?” and “Does the distribution change over time or in response to significant events?” In this post, we summarize how non-confidential data can be used to answer these questions by providing publicly available proxies for bank-level reserves.
Do Payout Restrictions Reduce Bank Risk?

In June 2020, the Federal Reserve issued stringent payout restrictions for the largest banks in the United States as part of its policy response to the COVID-19 crisis. Similar curbs on share buybacks and dividend payments were adopted in other jurisdictions, including in the eurozone, the U.K., and Canada. Payout restrictions were aimed at enhancing banks’ resiliency amid heightened economic uncertainty and concerns about the risk of large losses. But besides being a tool to build capital buffers and preserve bank equity, payout restrictions may also prevent risk-shifting. This post, which is based on our recent research paper, attempts to answer whether and how payout restrictions reduce bank risk using the U.S. experience during the pandemic as a case study.
Anatomy of the Bank Runs in March 2023

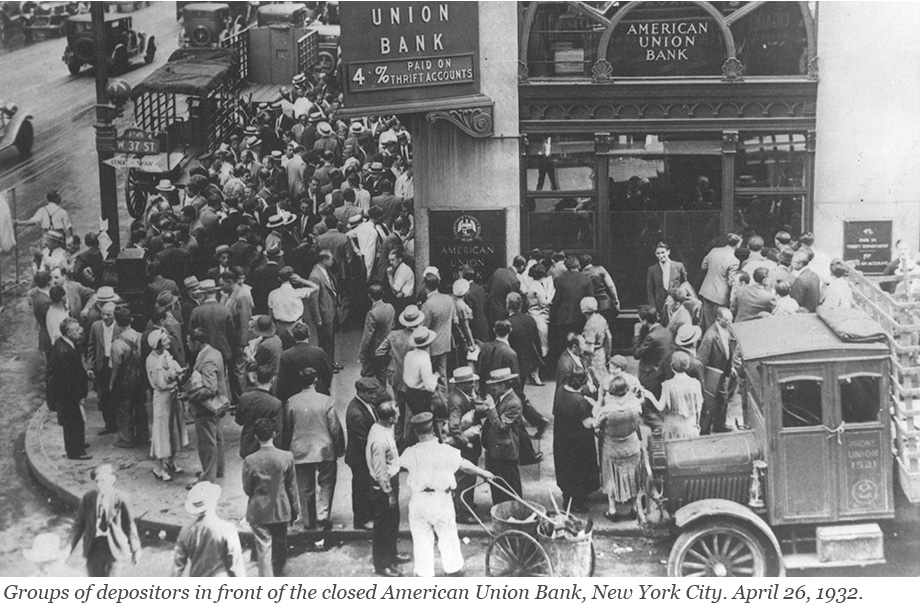
Runs have plagued the banking system for centuries and returned to prominence with the bank failures in early 2023. In a traditional run—such as depicted in classic photos from the Great Depression—depositors line up in front of a bank to withdraw their cash. This is not how modern bank runs occur: today, depositors move money from a risky to a safe bank through electronic payment systems. In a recently published staff report, we use data on wholesale and retail payments to understand the bank run of March 2023. Which banks were run on? How were they different from other banks? And how did they respond to the run?
The Disparate Outcomes of Bank‑ and Nonbank‑Financed Private Credit Expansions

Long-run trends in increased access to credit are thought to improve real activity. However, “rapid” credit expansions do not always end well and have been shown in the academic literature to predict adverse real outcomes such as lower GDP growth and an increased likelihood of crises. Given these financial stability considerations associated with rapid credit expansions, being able to distinguish in real time “good booms” from “bad booms” is of crucial interest for policymakers. While the recent literature has focused on understanding how the composition of borrowers helps distinguish good and bad booms, in this post we investigate how the composition of lending during a credit expansion matters for subsequent real outcomes.
Deposits and the March 2023 Banking Crisis—A Retrospective

In this post, we evaluate how deposits have evolved over the latter portion of the current monetary policy tightening cycle. We find that while deposit betas have continued to rise, they did not accelerate following the bank runs in March 2023. In addition, while overall deposit funding has remained stable, we find that the banks most affected by the March 2023 events are offering higher deposit rates and are growing their deposit funding relative to the broader banking industry.
An Overlooked Factor in Banks’ Lending to Minorities

In the second quarter of 2022, the homeownership rate for white households was 75 percent, compared to 45 percent for Black households and 48 percent for Hispanic households. One reason for these differences, virtually unchanged in the last few decades, is uneven access to credit. Studies have documented that minorities are more likely to be denied credit, pay higher rates, be charged higher fees, and face longer turnaround times compared to similar non-minority borrowers. In this post, which is based on a related Staff Report, we show that banks vary substantially in their lending to minorities, and we document an overlooked factor in this difference—the inequality aversion of banks’ stakeholders.
Does Trade Uncertainty Affect Bank Lending?

The recent era of global trade expansion is over. Faced with increased geopolitical risk, fragile foreign supply chains, and uncertainties in the international trade environment, firms are postponing entry into foreign markets and pulling back from foreign activities (IMF 2023). Besides its direct effects on real activity, the recent rise in trade uncertainty has potentially important implications for the financial sector. This post describes how the lending activities of U.S. banks were affected by the rise in trade uncertainty during the 2018-19 “trade war.” In particular, banks that were more exposed to trade uncertainty contracted lending to all of their domestic nonfinancial business borrowers, regardless of whether these borrowers were facing high or low uncertainty themselves. Furthermore, banks’ lending strategies exhibited the type of “wait-and-see” behavior usually found in corporate firms facing investment decisions under uncertainty, and the lending contraction was larger for those banks that were more financially constrained.
The Nonbank Shadow of Banks

Financial and technological innovation and changes in the macroeconomic environment have led to the growth of nonbank financial institutions (NBFIs), and to the possible displacement of banks in the provision of traditional financial intermediation services (deposit taking, loan making, and facilitation of payments). In this post, we look at the joint evolution of banks—referred to as depository institutions from here on—and nonbanks inside the organizational structure of bank holding companies (BHCs). Using a unique database of the organizational structure of all BHCs ever in existence since the 1970s, we document the evolution of NBFI activities within BHCs. Our evidence suggests that there exist important conglomeration synergies to having both banks and NBFIs under the same organizational umbrella.
Banks’ Balance‑Sheet Costs and ON RRP Investment

Daily investment at the Federal Reserve’s Overnight Reverse Repo (ON RRP) facility increased from a few billion dollars in March 2021 to more than $2.3 trillion in June 2022 and has stayed above $2 trillion since then. In this post, which is based on a recent staff report, we discuss two channels—a deposit channel and a wholesale short-term debt channel—through which banks’ balance-sheet costs have increased investment by money market mutual funds (MMFs) in the ON RRP facility.
Bank Funding during the Current Monetary Policy Tightening Cycle

Recent events have highlighted the importance of understanding the distribution and composition of funding across banks. Market participants have been paying particular attention to the overall decline of deposit funding in the U.S. banking system as well as the reallocation of deposits within the banking sector. In this post, we describe changes in bank funding structure since the onset of monetary policy tightening, with a particular focus on developments through March 2023.


 RSS Feed
 Follow Liberty Street Economics