









51 posts on "Federal Reserve"
October 5, 2022
Measuring the Ampleness of Reserves

Over the past fifteen years, reserves in the banking system have grown from tens of billions of dollars to several trillion dollars. This extraordinary rise poses a natural question: Are the rates paid in the market for reserves still sensitive to changes in the quantity of reserves when aggregate reserve holdings are so large? In today’s post, we answer this question by estimating the slope of the reserve demand curve from 2010 to 2022, when reserves ranged from $1 trillion to $4 trillion.
Posted at 7:00 am in Banks, Central Bank, Federal Reserve, Financial Institutions, Financial Markets, Monetary Policy | Permalink
September 8, 2022
How Can Safe Asset Markets Be Fragile?

The market for U.S. Treasury securities experienced extreme stress in March 2020, when prices dropped precipitously (yields spiked) over a period of about two weeks. This was highly unusual, as Treasury prices typically increase during times of stress. Using a theoretical model, we show that markets for safe assets can be fragile due to strategic interactions among investors who hold Treasury securities for their liquidity characteristics. Worried about having to sell at potentially worse prices in the future, such investors may sell preemptively, leading to self-fulfilling “market runs” that are similar to traditional bank runs in some respects.
July 29, 2022
The Transatlantic Economy Policy Responses to the Pandemic and the Road to Recovery Conference
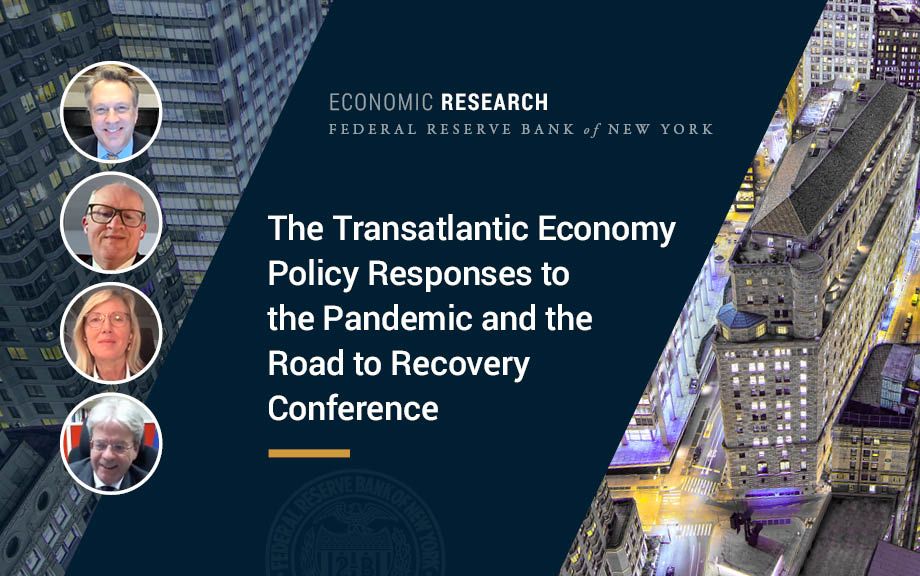
The Federal Reserve Bank of New York, the European Commission, and the Center for Economic and Policy Research (CEPR) jointly organized the conference “Transatlantic Economic Policy Responses to the Pandemic and the Road to Recovery,” on November 18, 2021. The conference brought together U.S. and European-based policymakers and economists from academia, think tanks, and international financial institutions to discuss issues that transatlantic policymakers are facing. The conference was held before the Russian invasion of Ukraine and the global monetary tightening. Still, its medium to long-term focus provides interesting insights on economic policy challenges ahead.
June 24, 2022
How Could Oil Price and Policy Rate Hikes Affect the Near‑Term Inflation Outlook?

Since the start of the year, oil prices have risen sharply owing to worsening expectations regarding global oil supply. We’ve also had an acceleration of inflation in the United States and the euro area, as well as a sharp steepening of the expected paths of policy rates in both economies. These factors, combined with the potential for a slowdown in growth, have made the inflation outlook quite uncertain. In this post, we combine the demand and supply oil price decomposition from the New York Fed’s Oil Price Dynamics Report with yield curve data to quantify the likely path of inflation in the United States and the euro area over the next twelve months. Based on our analysis, we anticipate that inflation will likely remain elevated through the second quarter of 2023, despite payback for the inflationary impact of current negative oil supply shocks during the second half of 2022 and the disinflationary effects of tighter monetary policy.
Posted at 7:00 am in Forecasting, Inflation, Macroeconomics, Monetary Policy | Permalink | Comments (2)
April 12, 2022
The Fed’s Balance Sheet Runoff: The Role of Levered NBFIs and Households

In a Liberty Street Economics post that appeared yesterday, we described the mechanics of the Federal Reserve’s balance sheet “runoff” when newly issued Treasury securities are purchased by banks and money market funds (MMFs). The same mechanics would largely hold true when mortgage-backed securities (MBS) are purchased by banks. In this post, we show what happens when newly issued Treasury securities are purchased by levered nonbank financial institutions (NBFIs)—such as hedge funds or nonbank dealers—and by households.
Posted at 7:00 am in Central Bank, COVID-19 Facilities, Federal Reserve, Monetary Policy, Nonbank (NBFI) | Permalink | Comments (1)
April 11, 2022
The Fed’s Balance Sheet Runoff and the ON RRP Facility

A 2017 Liberty Street Economics post described the balance sheet effects of the Federal Open Market Committee’s decision to cease reinvestments of maturing securities—that is, the mechanics of the Federal Reserve’s balance sheet “runoff.” At the time, the overnight reverse repo (ON RRP) facility was fairly small (less than $200 billion for most of July 2017) and was not mentioned in the post for the sake of simplicity. Today, by contrast, take-up at the ON RRP facility is much larger (over $1.5 trillion for most of 2022). In this post, we update the earlier analysis and describe how the presence of the ON RRP facility affects the mechanics of the balance sheet runoff.
Posted at 7:00 am in Central Bank, COVID-19 Facilities, Federal Reserve, Monetary Policy, Repo | Permalink | Comments (3)
February 16, 2022
The Making of Fallen Angels—and What QE and Credit Rating Agencies Have to Do with It

Riskier firms typically borrow at higher rates than safer firms because investors require compensation for taking on more risk. However, since 2009 this relationship has been turned on its head in the massive BBB corporate bond market, with risky BBB-rated firms borrowing at lower rates than their safer BBB-rated peers. The resulting risk materialized in an unprecedented wave of “fallen angels” (or firms downgraded below the BBB investment-grade threshold) at the onset of the COVID-19 pandemic. In this post, based on a related Staff Report, we claim that this anomaly has been driven by a combination of factors: a boost in investor demand for investment-grade bonds associated with the Federal Reserve’s quantitative easing (QE) and sluggish adjustment of credit ratings for risky BBB issuers.
January 13, 2022
The Fed’s Latest Tool: A Standing Repo Facility
In July 2021, the Federal Open Market Committee announced a new tool for monetary policy implementation: a domestic standing repurchase agreement facility. In the last post of this series, we explain what this new tool is and how it will support the effective implementation of monetary policy in the floor system through which the Fed implements policy.
January 11, 2022
How the Fed’s Overnight Reverse Repo Facility Works
Daily take-up at the overnight reverse repo (ON RRP) facility increased from less than $1 billion in early March 2021 to just under $2 trillion on December 31, 2021. In the second post in this series, we take a closer look at this important tool in the Federal Reserve’s monetary policy implementation framework and discuss the factors behind the recent increase in volume.
Posted at 7:00 am in Bank Capital, Banks, Central Bank, COVID-19 Facilities, Credit, Crisis, Fed Funds, Federal Reserve, Financial Institutions, Monetary Policy, Pandemic, Repo | Permalink
January 10, 2022
How the Federal Reserve’s Monetary Policy Implementation Framework Has Evolved
In a series of four posts, we review key elements of the Federal Reserve’s monetary policy implementation framework. The framework has changed markedly in the last two decades. Prior to the global financial crisis, the Fed used a system of scarce reserves and fine-tuned the supply of reserves to maintain rate control. However, since then, the Fed has operated in a floor system, where active management of the supply of reserves no longer plays a role in rate control, but rather the Fed’s administered rates influence the federal funds rate. In this first post, we discuss the salient features of the implementation framework in a stylized way.
Posted at 7:00 am in Central Bank, Fed Funds, Federal Reserve, Monetary Policy | Permalink | Comments (1)
 RSS Feed
 Follow Liberty Street Economics