


49 posts on "Federal Reserve"
January 17, 2025
Discount Window Stigma After the Global Financial Crisis
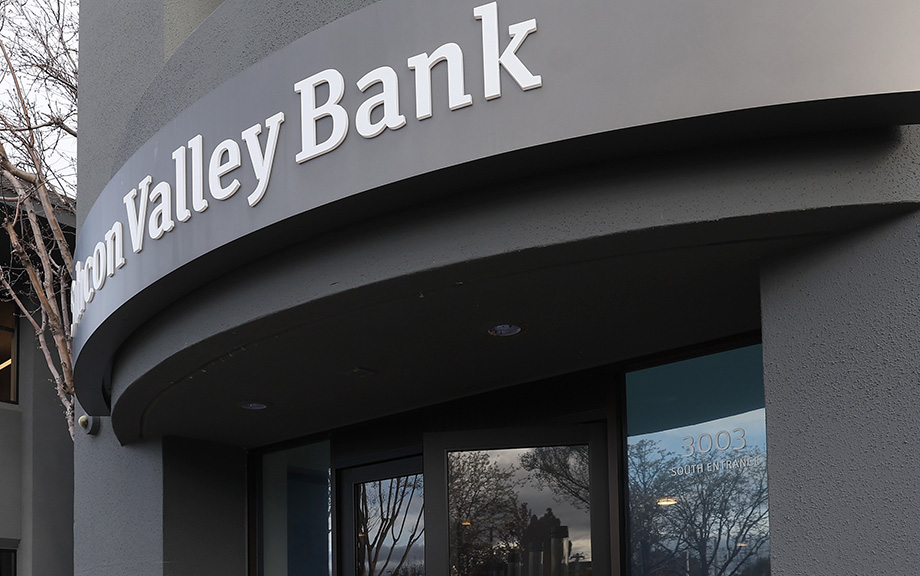
The rapidity of deposit outflows during the March 2023 banking run highlights the important role that the Federal Reserve’s discount window should play in strengthening financial stability. A lack of borrowing, however, has plagued the discount window for decades, likely due to banks’ concerns about stigma—that is, their unwillingness to borrow at the discount window because it may be viewed as a sign of financial weakness in the eyes of regulators and market participants. The discount window has been reformed several times to alleviate this problem. Although the presence of stigma during the great financial crisis has been documented empirically, we do not know whether stigma has remained since then. In this post, based on a recent Staff Report, we fill this gap by using transaction-level data from the federal funds market to examine whether the discount window remains stigmatized today.
Posted at 7:00 am in Central Bank | Permalink
December 18, 2023
Hey, Economist! Outgoing Advisor Antoine Martin Reflects on How His New York Fed Perch Has Shaped His Work

Antoine Martin, an economist and financial stability advisor in the New York Fed’s Research and Statistics Group, will soon take up a new post at the Swiss National Bank (SNB), as head of its third department covering money markets/foreign exchange (FX). In that role, Martin, who is originally from Switzerland, also becomes one of three members of that central bank’s rate-setting governing board. Readers of Liberty Street Economics will be familiar with his byline, as he has written more than sixty posts presenting new research findings and policy analysis, all with an eye for breaking down the most complicated topics in clear terms. He took a few questions from publications editor Anna Snider about his experiences and future plans as he prepares to move on.
November 21, 2023
The New York Fed DSGE Model Perspective on the Lagged Effect of Monetary Policy

This post uses the New York Fed DSGE model to ask the question: What would have happened to interest rates, output, and inflation had the Federal Reserve been following an average inflation targeting (AIT)-type reaction function since 2021:Q2, when inflation began to rise—as opposed to keeping the federal funds rate at the zero lower bound (ZLB) until March 2022, and then raising it aggressively thereafter? We show that actual policy was more accommodative in 2021 than implied by the AIT reaction function and then more contractionary in 2022 and beyond. On net, the lagged effect of monetary policy on the level of GDP, when measured relative to the counterfactual, has been positive throughout the forecast horizon, due to the initial boost associated with keeping the fed funds rate near zero in 2021.
August 17, 2023
Consumers’ Perspectives on the Recent Movements in Inflation
Editors Note: The title of this post has been changed from the original. August 17, 2023, 10:35 a.m.

Inflation in the U.S. has experienced unusually large movements in the last few years, starting with a steep rise between the spring of 2021 and June 2022, followed by a relatively rapid decline over the past twelve months. This marks a stark departure from an extended period of low and stable inflation. Economists and policymakers have expressed differing views about which factors contributed to these large movements (as reported in the media here, here, here, and here), leading to fierce debates in policy circles, academic journals, and the press. We know little, however, about the consumer’s perspective on what caused these sudden movements in inflation. In this post, we explore this question using a special module of the Federal Reserve Bank of New York’s Survey of Consumer Expectations (SCE) in which consumers were asked what they think contributed to the recent movements in inflation. We find that consumers think supply-side issues were the most important factor behind the 2021-22 inflation surge, while they regard Federal Reserve policies as the most important factor behind the recent and expected future decline in inflation.
June 23, 2023
2nd Annual International Roles of the U.S. Dollar Conference

The U.S. dollar plays a central role in the global economy. In addition to being the most widely used currency in foreign exchange transactions, it represents the largest share in official reserves, international debt securities and loans, cross-border payments, and trade invoicing. The ubiquity of the U.S. dollar in global transactions reflects several key factors, including the depth and liquidity of U.S. capital markets, the size of the U.S. economy, the relatively low cost of converting dollars into other currencies, and an enduring confidence in the U.S. legal system and its institutions.
May 11, 2023
Bank Funding during the Current Monetary Policy Tightening Cycle
Recent events have highlighted the importance of understanding the distribution and composition of funding across banks. Market participants have been paying particular attention to the overall decline of deposit funding in the U.S. banking system as well as the reallocation of deposits within the banking sector. In this post, we describe changes in bank funding structure since the onset of monetary policy tightening, with a particular focus on developments through March 2023.
Posted at 7:00 am in Bank Capital, Banks, Federal Reserve, Financial Institutions | Permalink | Comments (1)
February 13, 2023
How Much Can the Fed’s Tightening Contract Global Economic Activity?

What types of foreign firms are most affected when the Federal Reserve raises its policy rate? Recent empirical research used cross-country firm level data and information on input-output linkages and finds that the impact on sales and investment spending is largest in sectors with exposure to trade in intermediate goods. The research also finds that financial factors drive differences, with U.S. monetary policy spillovers having a much smaller impact on firms that are less financially constrained.
January 17, 2023
The Recent Rise in Discount Window Borrowing
The Federal Reserve’s primary credit program—offered through its “discount window” (DW)—provides temporary short-term funding to fundamentally sound banks. Historically, loan activity has been low during normal times due to a variety of factors, including the DW’s status as a back-up source of liquidity with a relatively punitive interest rate, the stigma attached to DW borrowing from the central bank, and, since 2008, elevated levels of reserves in the banking system. However, beginning in 2022, DW borrowing under the primary credit program increased notably in comparison to past years. In this post, we examine the factors that may have contributed to this recent trend.
October 5, 2022
Measuring the Ampleness of Reserves

Over the past fifteen years, reserves in the banking system have grown from tens of billions of dollars to several trillion dollars. This extraordinary rise poses a natural question: Are the rates paid in the market for reserves still sensitive to changes in the quantity of reserves when aggregate reserve holdings are so large? In today’s post, we answer this question by estimating the slope of the reserve demand curve from 2010 to 2022, when reserves ranged from $1 trillion to $4 trillion.
Posted at 7:00 am in Banks, Central Bank, Federal Reserve, Financial Institutions, Financial Markets, Monetary Policy | Permalink
September 8, 2022
How Can Safe Asset Markets Be Fragile?

The market for U.S. Treasury securities experienced extreme stress in March 2020, when prices dropped precipitously (yields spiked) over a period of about two weeks. This was highly unusual, as Treasury prices typically increase during times of stress. Using a theoretical model, we show that markets for safe assets can be fragile due to strategic interactions among investors who hold Treasury securities for their liquidity characteristics. Worried about having to sell at potentially worse prices in the future, such investors may sell preemptively, leading to self-fulfilling “market runs” that are similar to traditional bank runs in some respects.
 RSS Feed
 Follow Liberty Street Economics