Understanding the Racial and Income Gap in COVID‑19: Public Transportation and Home Crowding

This is the second post in a series that aims to understand the gap in COVID-19 intensity by race and income. In our post yesterday, we looked at how comorbidities, uninsurance rates, and health resources may help to explain the race and income gap observed in COVID-19 intensity. We found that a quarter of the income gap and more than a third of the racial gap in case rates are explained by health status and system factors. In this post, we look at two factors related to indoor density—namely the use of public transportation and increased home crowding. Here, we will aim to understand whether these two factors affect overall COVID-19 intensity, whether the income and racial gaps of COVID can be further explained when we additionally include these factors, and whether and to what extent these factors independently account for income and racial gaps in COVID-19 intensity (without controlling for the factors considered in the other posts in this series).
Understanding the Racial and Income Gap in Covid‑19: Health Insurance, Comorbidities, and Medical Facilities

Our previous work documents that low-income and majority-minority areas were considerably more affected by COVID-19, as captured by markedly higher case and death rates. In a four-part series starting with this post, we seek to understand the reasons behind these income and racial disparities. Do disparities in health status translate into disparities in COVID-19 intensity? Does the health system play a role through health insurance and hospital capacity? Can disparities in COVID-19 intensity be explained by high-density, crowded environments? Does social distancing, pollution, or the age composition of the county matter? Does the prevalence of essential service jobs make a difference? This post will focus on the first two questions. The next three posts in this series will focus on the remaining questions. The posts will follow a similar structure. In each post, we will aim to understand whether the factors considered in that post affect overall COVID-19 intensity, whether the racial and income gaps can be further explained when we additionally include the factors in consideration in that post, and whether and to what extent the factors under consideration in that post independently affect racial and income gaps in COVID-19 intensity (without controlling for the factors considered in the other posts in this series).
Understanding Heterogeneous Agent New Keynesian Models: Insights from a PRANK

To shed light on the macroeconomic consequences of heterogeneity, Acharya and Dogra develop a stylized HANK model that contains key features present in more complicated HANK models.
Does U.S. Health Inequality Reflect Income Inequality—or Something Else?
Health is an integral part of well-being. The United Nations Human Development Index uses life expectancy (together with GDP per capita and literacy) as one of three key indicators of human welfare across the world. In this post, I discuss the state of life expectancy inequality in the United States and examine some of the underlying factors in its evolution over the past several decades.
Job Ladders and Careers

Workers in the United States experience vast differences in lifetime earnings. Individuals in the 90th percentile earn around seven times more than those in the 10th percentile, and those in the top percentile earn almost twenty times more. A large share of these differences arise over the course of people’s careers. What accounts for these vastly different outcomes in the labor market? Why do some individuals experience much steeper earnings profiles than others? Previous research has shown that the “job ladder”—in which workers obtain large pay increases when they switch to better jobs or when firms want to poach them—is important for wage growth. In this post, we investigate how job ladders differ across workers.
Some Places Are Much More Unequal than Others

Economic inequality in the United States is much more pronounced in some parts of the country than others. In this post, we examine the geography of wage inequality, drawing on our recent Economic Policy Review article. We find that the most unequal places tend to be large urban areas with strong economies where wage growth has been particularly strong for those at the top of the wage distribution.
Introduction to Heterogeneity Series: Understanding Causes and Implications of Various Inequalities

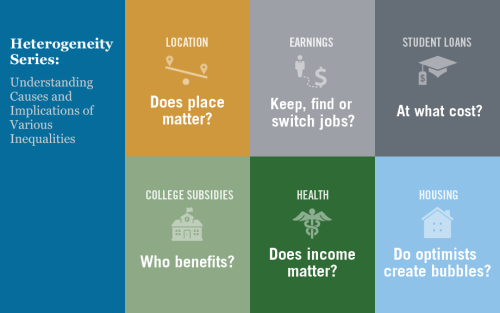
Economic analysis is often geared toward understanding the average effects of a given policy or program. Likewise, economic policies frequently target the average person or firm. While averages are undoubtedly useful reference points for researchers and policymakers, they don’t tell the whole story: it is vital to understand how the effects of economic trends and government policies vary across geographic, demographic, and socioeconomic boundaries. It is also important to assess the underlying causes of the various inequalities we observe around us, be they related to income, health, or any other set of indicators. Starting today, we are running a series of six blog posts (apart from this introductory post), each of which focuses on an interesting case of heterogeneity in the United States today.
Did the Value of a College Degree Decline during the Great Recession?

In an earlier post, we studied how educational attainment affects labor market outcomes and earnings inequality. In this post, we investigate whether these labor market effects were preserved across the last business cycle: Did students with certain types of educational attainment weather the recession better?


 RSS Feed
 Follow Liberty Street Economics