


30 posts on "Joelle Scally"
May 19, 2021
What Happens during Mortgage Forbearance?
As we discussed in our previous post, millions of mortgage borrowers have entered forbearance since the beginning of the pandemic, and over 2 million remain in a program as of March 2021. In this post, we use our Consumer Credit Panel (CCP) data to examine borrower behavior while in forbearance. The credit bureau data are ideal for this purpose because they allow us to follow borrowers over time, and to connect developments on the mortgage with those on other credit products. We find that forbearance results in reduced mortgage delinquencies and is associated with increased paydown of other debts, suggesting that these programs have significantly improved the financial positions of the borrowers who received them.
Keeping Borrowers Current in a Pandemic
Federal government actions in response to the pandemic have taken many forms. One set of policies is intended to reduce the risk that the pandemic will result in a housing market crash and a wave of foreclosures like the one that accompanied the Great Financial Crisis. An important and novel tool employed as part of these policies is mortgage forbearance, which provides borrowers the option to pause or reduce debt service payments during periods of hardship, without marking the loan delinquent on the borrower’s credit report. Widespread take-up of forbearance over the past year has significantly changed the housing finance system in the United States, in different ways for different borrowers. This post is the first of four focusing attention on the effects of mortgage forbearance and the outlook for the mortgage market. Here we use data from the New York Fed’s Consumer Credit Panel (CCP) to examine the effects of these changes on households during the pandemic.
May 12, 2021
Credit Card Balance Declines Are Largest Among Older, Wealthier Borrowers

Total household debt rose by $85 billion in the first quarter of 2021, according to the latest Quarterly Report on Household Debt and Credit from the New York Fed’s Center for Microeconomic Data. Since the start of the pandemic, household debt balances have increased in every quarter but one—the second quarter of 2020, when lockdowns were in full effect. The Quarterly Report and this analysis are based on the New York Fed’s Consumer Credit Panel, which is based on Equifax credit data.
November 17, 2020
Following Borrowers through Forbearance

Today, the New York Fed’s Center for Microeconomic Data reported that total household debt balances increased slightly in the third quarter of 2020, according to the latest Quarterly Report on Household Debt and Credit. This increase marked a reversal from the modest decline in the second quarter of 2020, a downturn driven by a sharp contraction in credit card balances. In the third quarter, credit card balances declined again, even as consumer spending recovered somewhat; meanwhile, mortgage originations came in at a robust $1.049 trillion, the highest level since 2003. Many of the efforts to stabilize the economy in response to the COVID-19 crisis have focused on consumer balance sheets, both through direct cash transfers and through forbearances on federally backed debts. Here, we examine the uptake of forbearances on mortgage and auto loans and its impact on their delinquency status and the borrower’s credit score. This analysis, as well as the Quarterly Report on Household Debt and Credit, is based on anonymized Equifax credit report data.
August 19, 2020
August 18, 2020
Debt Relief and the CARES Act: Which Borrowers Benefit the Most?
COVID-19 and associated social distancing measures have had major labor market ramifications, with massive job losses and furloughs. Millions of people have filed jobless claims since mid-March—6.9 million in the week of March 28 alone. These developments will surely lead to financial hardship for millions of Americans, especially those who hold outstanding debts while facing diminishing or disappearing wages. The CARES Act, passed by Congress on April 2, 2020, provided $2.2 trillion in disaster relief to combat the economic impacts of COVID-19. Among other measures, it included mortgage and student debt relief measures to alleviate the cash flow problems of borrowers. In this post, we examine who could benefit most (and by how much) from various debt relief provisions under the CARES Act.
Posted at 7:00 am in Equitable Growth, Household Finance, Housing, Inequality | Permalink | Comments (2)
July 8, 2020
Inequality in U.S. Homeownership Rates by Race and Ethnicity
Homeownership has historically been an important means for Americans to accumulate wealth—in fact, at more than $15 trillion, housing equity accounts for 16 percent of total U.S. household wealth. Consequently, the U.S. homeownership cycle has triggered large swings in Americans’ net worth over the past twenty-five years. However, the nature of those swings has varied significantly by race and ethnicity, with different demographic groups tracing distinct trajectories through the housing boom, the foreclosure crisis, and the subsequent recovery. Here, we look into the dynamics underlying these divergences and explore some potential explanations.
July 7, 2020
Introduction to Heterogeneity Series III: Credit Market Outcomes
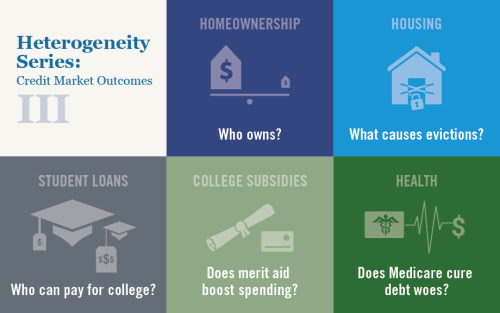
Following up series on heterogeneity and inequality broadly and in labor market outcomes specifically, we turn our focus to further documenting heterogeneity in credit market outcomes, looking at disparities in home ownership rates, varying exposure to evictions, differing gains from tuition support and Medicare programs, and more.
May 5, 2020
U.S. Consumer Debt Payments and Credit Buffers on the Eve of COVID‑19
Today, the New York Fed’s Center for Microeconomic Data released the Quarterly Report on Household Debt and Credit for 2020:Q1. Because consumer debt servicing statements are typically furnished to credit bureaus only once during every statement period, our snapshot of consumer credit reports as of March 31, 2020 is, in effect, a pre-COVID-19 view of the consumer balance sheet. While significant indications of the pandemic are yet to appear in our Consumer Credit Panel (CCP—the data source for the Quarterly Report, based on Equifax credit reports), we are able to observe the credit position of the American consumer just as the pandemic and associated lockdowns struck the United States.
Posted at 11:00 am in Household Finance | Permalink
February 11, 2020
Charging into Adulthood: Credit Cards and Young Consumers

The New York Fed’s Center for Microeconomic Data today released the Quarterly Report on Household Debt and Credit for the fourth quarter of 2019. Total household debt balances grew by $193 billion in the fourth quarter, marking a $601 billion increase in household debt balances in 2019, the largest annual gain since 2007. The main driver was a $433 billion annual upswing in mortgage balances, also the largest since 2007.
 RSS Feed
 Follow Liberty Street Economics