Blog Series on the Economic and Financial Impacts of Extreme Weather Events in the Fed’s Second District
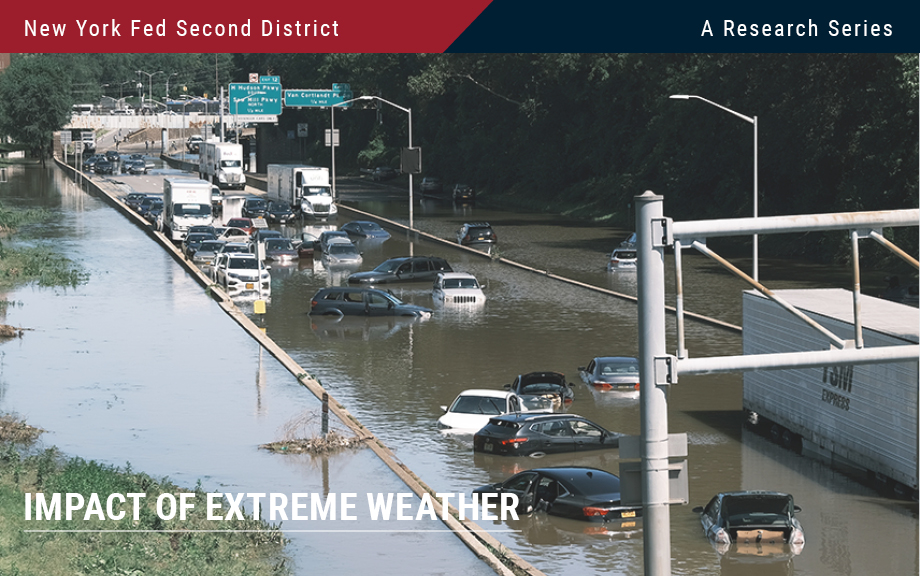
The frequency and ferocity of extreme weather events, such as flooding, storms, and deadly heat waves, have been on the rise in recent years. These climate events, along with human adaption to cope with them, may have large effects on the economy and financial markets. It is therefore paramount to provide research about the economy’s vulnerability to climate events for policymakers, households, financial institutions, and other players in the world economy to make informed decisions. In the coming days, we are going to present a series of nine posts that attempt to take a step in this direction while focusing on the Federal Reserve System’s Second District (NY, northern NJ, southwest CT, Puerto Rico, and the U.S. Virgin Islands). The twelve Federal Reserve Districts are depicted in this map.
Is the Green Transition Inflationary?

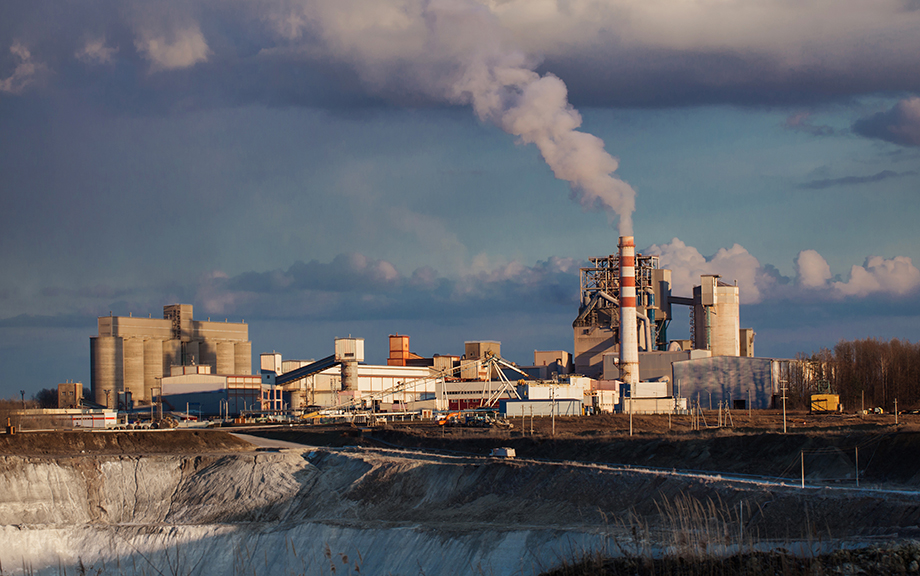
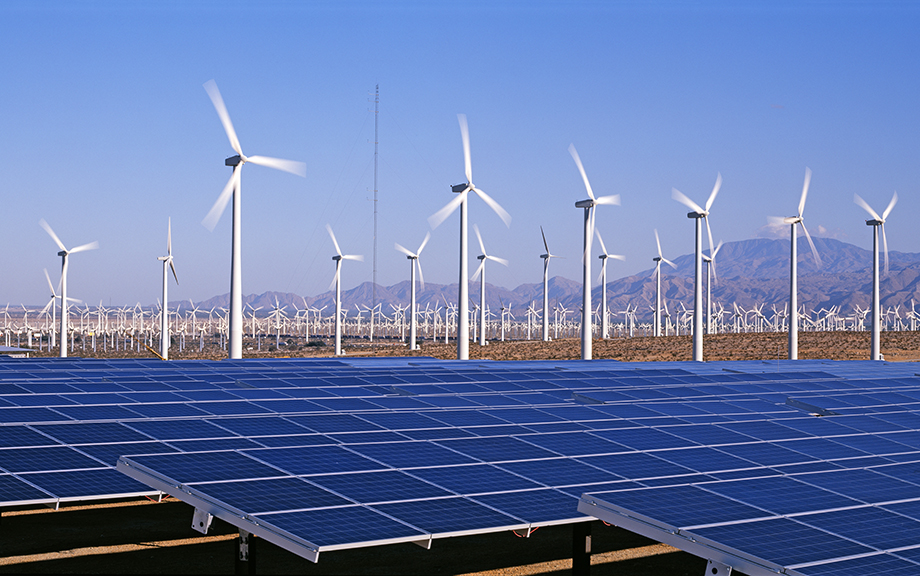
Are policies aimed at fighting climate change inflationary? In a new staff report we use a simple model to argue that this does not have to be the case. The model suggests that climate policies do not force a central bank to tolerate higher inflation but may generate a trade-off between inflation and employment objectives. The presence and size of this trade-off depends on how flexible prices are in the “dirty” and “green” sectors relative to the rest of the economy, and on whether climate policies consist of taxes or subsidies.
How Much Can the Fed’s Tightening Contract Global Economic Activity?
What types of foreign firms are most affected when the Federal Reserve raises its policy rate? Recent empirical research used cross-country firm level data and information on input-output linkages and finds that the impact on sales and investment spending is largest in sectors with exposure to trade in intermediate goods. The research also finds that financial factors drive differences, with U.S. monetary policy spillovers having a much smaller impact on firms that are less financially constrained.
Highlights from the Fifth Bi‑annual Global Research Forum on International Macroeconomics and Finance

The COVID-19 pandemic, geopolitical tensions, and distinct economic conditions bring challenges to economies worldwide. These key themes provided a backdrop for the fifth bi-annual Global Research Forum on International Macroeconomics and Finance, organized by the European Central Bank (ECB), the Federal Reserve Board, and Federal Reserve Bank of New York in New York in November. The papers and discussions framed important issues related to the global economy and financial markets, and explored the implications of policies that central banks and other official sector bodies take to address geopolitical developments and conditions affecting growth, inflation, and financial stability. A distinguished panel of experts shared diverse perspectives on the drivers of and prospects for inflation from a global perspective. In this post, we discuss highlights of the conference. The event page includes links to videos for each session.
How Much Did Supply Constraints Boost U.S. Inflation?

What factors are behind the recent inflation surge has been a huge topic of debate amongst academics and policymakers. We know that pandemic-related supply constraints such as labor shortages and supply chain bottlenecks have been key factors pushing inflation higher. These bottlenecks started with the pandemic (lockdowns, sick workers) and were made worse by the push arising from increased demand caused by very expansionary fiscal and monetary policy. Our analysis of the relative importance of supply-side versus demand-side factors finds 60 percent of U.S. inflation over the 2019-21 period was due to the jump in demand for goods while 40 percent owed to supply-side issues that magnified the impact of this higher demand.
Global Supply Chain Pressure Index: March 2022 Update
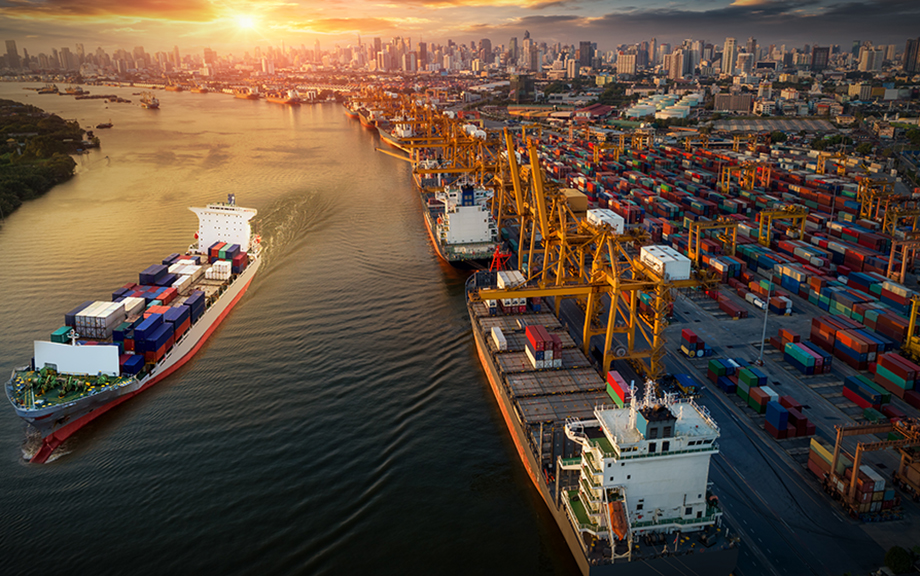
Supply chain disruptions continue to be a major challenge as the world economy recovers from the COVID-19 pandemic. In a January post, we presented the Global Supply Chain Pressure Index (GSCPI) as a parsimonious global measure that encompasses several indicators used to capture supply chain disruptions. The main purpose of this post is to provide an update of the GSCPI through February 2022. In addition, we use the index’s underlying data to discuss the drivers of recent moves in the GSCPI. Finally, these data are used to create country-specific supply chain pressures indices.
The Global Supply Side of Inflationary Pressures

U.S. inflation has surged as the economy recovers from the COVID-19 recession. This phenomenon has not been confined to the U.S. economy, as similar inflationary pressures have emerged in other advanced economies albeit not with the same intensity. In this post, we draw from the current international experiences to provide an assessment of the drivers of U.S. inflation. In particular, we exploit the link among different measures of inflation at the country level and a number of global supply side variables to uncover which common cross-country forces have been driving observed inflation. Our main finding is that global supply factors are very strongly associated with recent producer price index (PPI) inflation across countries, as well as with consumer price index (CPI) goods inflation, both historically and during the recent bout of inflation acceleration.
A New Barometer of Global Supply Chain Pressures
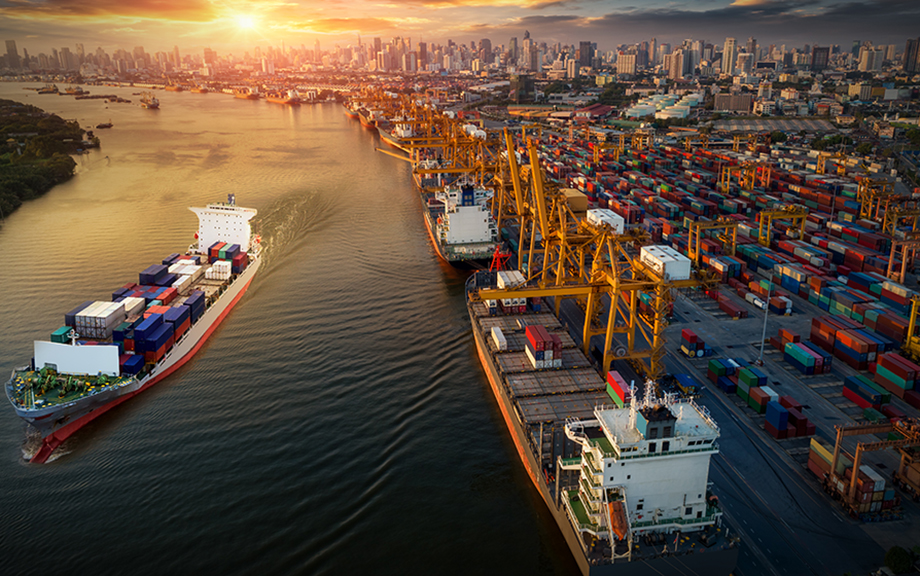
Supply chain disruptions have become a major challenge for the global economy since the start of the COVID-19 pandemic. Factory shutdowns (particularly in Asia) and widespread lockdowns and mobility restrictions have resulted in disruptions across logistics networks, increases in shipping costs, and longer delivery times. Several measures have been used to gauge these disruptions, although those measures tend to focus on selected dimensions of global supply chains. In this post, we propose a new gauge, the Global Supply Chain Pressure Index (GSCPI), which integrates a number of commonly used metrics with an aim to provide a more comprehensive summary of potential disruptions affecting global supply chains.


 RSS Feed
 Follow Liberty Street Economics