Who Is Still on First? An Update of Characteristics of First‑Time Homebuyers

Following the COVID-19 health crisis, home prices and mortgage rates rose sharply. This created concerns that first-time homebuyers (FTBs) would be disadvantaged and would lose ground. Earlier this year, we documented that the share of purchase mortgages by FTBs, as well as their share of home purchases, have actually increased slightly over the past couple of years. It appears that FTBs are holding their own in this challenging housing market. This raises the question of whether the characteristics of FTBs have changed. In a 2019 post, we described the characteristics of these buyers over the period from 2000 to 2016. In this post, we provide an update through 2024.
A Check‑In on the Mortgage Market

Debt balances continued to march upward in the second quarter of 2025, according to the latest Quarterly Report on Household Debt and Credit from the New York Fed’s Center for Microeconomic Data. Mortgage balances in particular saw an increase of $131 billion. Following a steep rise in home prices since 2019, several housing markets have seen dips in prices and concerns were sparked about the state of the mortgage market. Here, we disaggregate mortgage balances and delinquency rates by type and region to better understand the landscape of the current mortgage market, where any ongoing risks may lie, regionally and by product.
The Great Pandemic Mortgage Refinance Boom
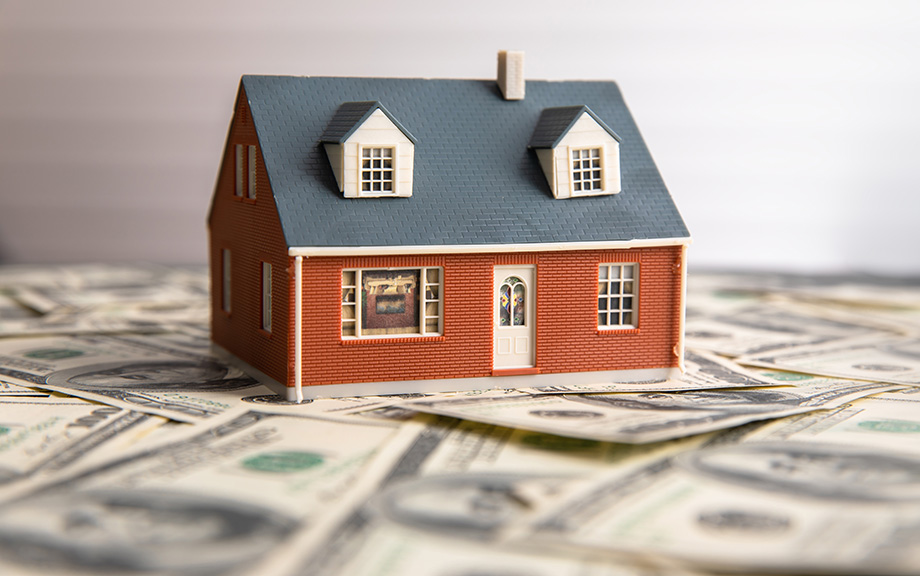
Total debt balances grew by $148 billion in the first quarter of 2023, a modest increase after 2022’s record growth. Mortgages, the largest form of household debt, grew by only $121 billion, according to the latest Quarterly Report on Household Debt and Credit from the New York Fed’s Center for Microeconomic Data. The increase was tempered by a sharp reduction in both purchase and refinance mortgage originations. The pandemic boom in purchase originations was driven by many factors – low mortgage rates, strong household balance sheets, and an increased demand for housing. Homeowners who refinanced in 2020 and 2021 benefitted from historically low interest rates and will be enjoying low financing costs for decades to come. These “rate refinance” borrowers have lowered their monthly mortgage payments, improving their cash flow, while other “cash-out” borrowers extracted equity from their real estate assets, making more cash available for consumption. Here, we explore the refi boom of 2020-21–who refinanced, who took out cash, and how much potential consumption support these transactions provided. In this analysis, as well as the Quarterly Report, we use our Consumer Credit Panel (CCP), which is based on anonymized credit reports from Equifax.
Does the CRA Increase Household Access to Credit?
Congress passed the Community Reinvestment Act (CRA) in 1977 to encourage banks to meet the needs of borrowers in the areas in which they operate. In particular, the Act is focused on credit access to low- and moderate-income communities that had historically been subject to discriminatory practices like redlining.
Unequal Distribution of Delinquencies by Gender, Race, and Education
This post is the second in a three-part series exploring racial, gender, and educational differences in household debt outcomes. In the first post, we examined how the propensity to take out household debt and loan amounts varied among students by race, gender, and education level, finding notable differences across all of these dimensions. Were these disparities in debt behavior by gender, race, and education level associated with differences in financial stress, as captured by delinquencies? This post focuses on this question.
If Prices Fall, Mortgage Foreclosures Will Rise

In our previous post, we illustrated the recent extraordinarily strong growth in home prices and explored some of its key spatial patterns. Such price increases remind many of the first decade of the 2000s when home prices reversed, contributing to a broad housing market collapse that led to a wave of foreclosures, a financial crisis, and a prolonged recession. This post explores the risk that such an event could recur if home prices go into reverse now. We find that although the situation looks superficially similar to the brink of the last crisis, there are important differences that are likely to mitigate the risks emanating from the housing sector.
The Housing Boom and the Decline in Mortgage Rates

During the pandemic, national home values and housing activity soared as mortgage rates declined to historic lows. Under the canonical “user cost” house price model, home values are held to be very sensitive to interest rates, especially at low interest rate levels. A calibration of this model can account for the house price boom with the observed decline in interest rates. But empirically, we find that home values are nowhere near as sensitive to interest rates as the user cost model predicts. This lower sensitivity is also found in prior economic research. Thus, the historical experience suggests that lower interest rates can only account for a tiny fraction of the pandemic house price boom. Instead, we find more scope for lower interest rates to explain the rise in housing activity, both sales and construction.
Small Business Owners Turn to Personal Credit

In our first post in this series we showed that mortgage provisions under the CARES ACT and its subsequent extensions resulted in a rapid take-up of mortgage forbearances, under which borrowers had the option to pause or reduce debt service payments without inducing a delinquency notation on their credit reports. Here we examine the forbearance take-up rate of a group of mortgage borrowers we expect to have been particularly hard hit by the pandemic recession: small business owners. Relatively little is known about how small business owners have fared over the past year in terms of their personal finances. Were they able to continue making mortgage payments on their homes? Did they draw on home equity to help fund their business operations?
What Happens during Mortgage Forbearance?
As we discussed in our previous post, millions of mortgage borrowers have entered forbearance since the beginning of the pandemic, and over 2 million remain in a program as of March 2021. In this post, we use our Consumer Credit Panel (CCP) data to examine borrower behavior while in forbearance. The credit bureau data are ideal for this purpose because they allow us to follow borrowers over time, and to connect developments on the mortgage with those on other credit products. We find that forbearance results in reduced mortgage delinquencies and is associated with increased paydown of other debts, suggesting that these programs have significantly improved the financial positions of the borrowers who received them.
Keeping Borrowers Current in a Pandemic
Federal government actions in response to the pandemic have taken many forms. One set of policies is intended to reduce the risk that the pandemic will result in a housing market crash and a wave of foreclosures like the one that accompanied the Great Financial Crisis. An important and novel tool employed as part of these policies is mortgage forbearance, which provides borrowers the option to pause or reduce debt service payments during periods of hardship, without marking the loan delinquent on the borrower’s credit report. Widespread take-up of forbearance over the past year has significantly changed the housing finance system in the United States, in different ways for different borrowers. This post is the first of four focusing attention on the effects of mortgage forbearance and the outlook for the mortgage market. Here we use data from the New York Fed’s Consumer Credit Panel (CCP) to examine the effects of these changes on households during the pandemic.


 RSS Feed
 Follow Liberty Street Economics