


109 posts on "pandemic"
July 8, 2025
The Fed’s Treasury Purchase Prices During the Pandemic
In March 2020, the Federal Reserve commenced purchases of U.S. Treasury securities to address the market disruptions caused by the pandemic. This post assesses the execution quality of those purchases by comparing the Fed’s purchase prices to contemporaneous market prices. Although past work has considered this question in the context of earlier asset purchases, the market dysfunction spurred by the pandemic means that execution quality at that time may have differed. Indeed, we find that the Fed’s execution quality was unusually good in 2020 in that the Fed bought Treasuries at prices appreciably lower than prevailing market offer prices.
March 26, 2025
Credit Score Impacts from Past Due Student Loan Payments

In our companion post, we highlighted how the pandemic and subsequent policy actions disrupted trends in the growth of student loan balances, the pace of repayment, and the classification of delinquent loans. In this post, we discuss how these changes affected the credit scores of student loan borrowers and how the return of negative reporting of past due balances will impact the credit standing of student loan borrowers. We estimate that more than nine million student loan borrowers will face significant drops in credit score once delinquencies appear on credit reports in the first half of 2025.
Student Loan Balance and Repayment Trends Since the Pandemic Disruption

This month marks five years since the start of the COVID-19 pandemic, after which subsequent policy responses upended most trends underlying student loans in the U.S. Beginning in March 2020, executive and legislative actions suspended student loan payments and the accumulation of interest for loans owned by the federal government. In addition, federal actions marked all past due and defaulted federal student loans as current, driving the delinquency rate on student loans below 1 percent by November 2022. Payments on federal student loans resumed in October 2023 after forty-three months of suspension. This post is the first of two highlighting trends in balances, repayment, and delinquency for student loans since the beginning of the COVID-19 pandemic and how trends may shift without pandemic supports.
July 16, 2024
What Was Up with Grocery Prices?

The consumer price index for groceries has risen more than the overall price index since the start of the pandemic, with a particularly large jump in 2022. In looking for explanations, a starting place is the behavior of raw commodity prices, which surged from early 2021 to mid-2022. In addition, wages for low-paid grocery workers have gone up faster than wages for the workforce as a whole. Finally, even though profit margins for grocery stores have gone up, the increase appears to be only a small contributor to the rise in food prices relative to the increase in their operating costs. This analysis suggests that the significant moderation in food inflation since the start of 2023 is due to still-high wage inflation for grocery workers being offset by the retreat in commodity prices.
June 28, 2024
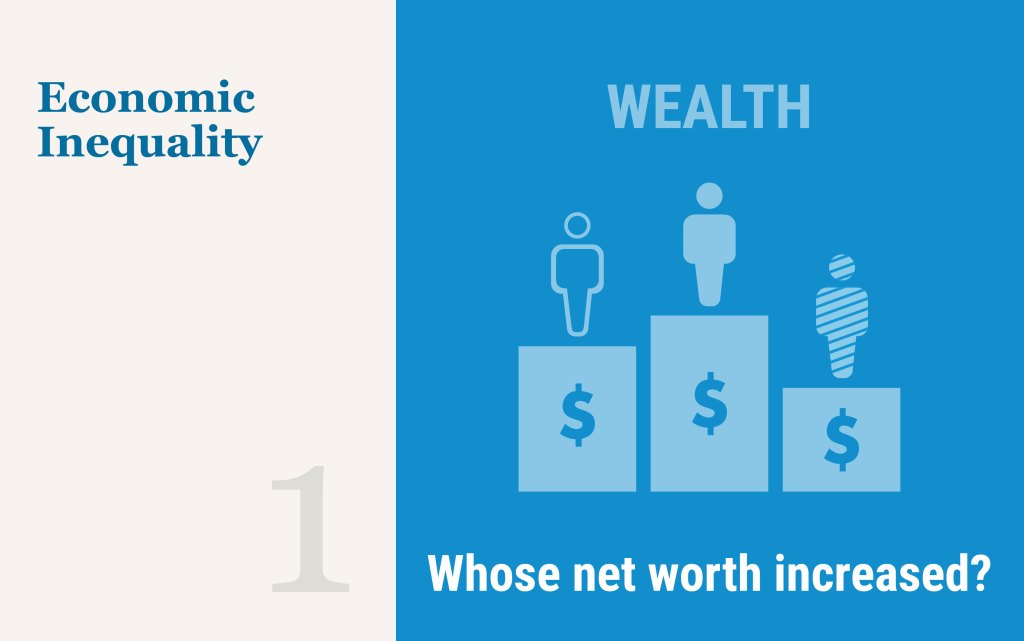
Racial and Ethnic Inequalities in Household Wealth Persist

Disparities in wealth are pronounced across racial and ethnic groups in the United States. As part of an ongoing series on inequality and equitable growth, we have been documenting the evolution of these gaps between Black, Hispanic, and white households, in this case from the first quarter of 2019 to the fourth quarter of 2023 for a variety of assets and liabilities for a pandemic-era picture. We find that real wealth grew and that the pace of growth for Black, Hispanic, and white households was very similar across this timeframe—yet gaps across groups persist.
May 9, 2024
The Post‑Pandemic Shift in Retirement Expectations in the U.S.

One of the most striking features of the labor market recovery following the pandemic recession has been the surge in quits from 2021 to mid-2023. This surge, often referred to as the Great Resignation, or the Great Reshuffle, was uncommonly large for an economic expansion. In this post, we call attention to a related labor market change that has not been previously highlighted—a persistent change in retirement expectations, with workers reporting much lower expectations of working full-time beyond ages 62 and 67. This decline is particularly notable for female workers and lower-income workers.
April 17, 2024
The New York Fed Consumer Credit Panel: A Foundational CMD Data Set

As the Great Financial Crisis and associated recession were unfolding in 2009, researchers at the New York Fed joined colleagues at the Board of Governors and Philadelphia Fed to create a new kind of data set. Household liabilities, particularly mortgages, had gone from being a quiet little corner of the financial system to the center of the worst financial crisis and sharpest recession in decades. The new data set was designed to provide fresh insights into this part of the economy, especially the behavior of mortgage borrowers. In the fifteen years since that effort came to fruition, the New York Fed Consumer Credit Panel (CCP) has provided many valuable insights into household behavior and its implications for the macro economy and financial stability.
The CCP was one of the first data sets drawn from credit bureau data, one of the earliest features of the Center for Microeconomic Data (CMD), and the primary source material for some of the CMD’s most important contributions to policy and research. Here we review a few of the main household debt themes over the past fifteen years, and how our analyses contributed to their understanding.
February 7, 2024
Racial and Ethnic Wealth Inequality in the Post‑Pandemic Era
Editor’s note: Since this post was first published, the authors updated their analysis to focus on the household level of wealth rather than the aggregate level. Please refer to the new blog post and findings here Racial and Ethnic Inequalities in Household Wealth Persist. (June 28, @ 7:19am)
Wealth is unevenly distributed across racial and ethnic groups in the United States. In this first post in a two-part series on wealth inequality, we use the Distributional Financial Accounts (DFA) to document these disparities between Black, Hispanic, and white households from the first quarter of 2019 to the third quarter of 2023 for wealth and a variety of asset and liability categories. We find that these disparities have been exacerbated since the pandemic, likely due to rapid growth in the financial assets more often held by white individuals.
Posted at 10:00 am in Demographics, Financial Markets, Inequality, Pandemic | Permalink | Comments (2)
October 18, 2023
Borrower Expectations for the Return of Student Loan Repayment
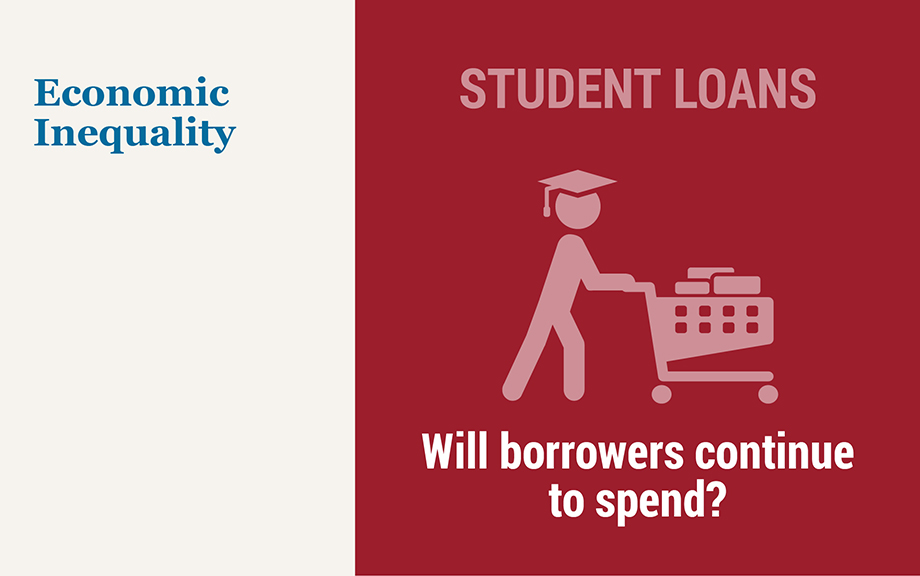
After forty-three months of forbearance, the pause on federal student loan payments has ended. Originally enacted at the onset of the COVID-19 pandemic in March 2020, the administrative forbearance and interest waiver lasted until September 1, 2023, and borrowers’ monthly payments resumed this month. As discussed in an accompanying post, the pause on student loan payments afforded borrowers over $260 billion in waived payments throughout the pandemic, supporting borrowers’ consumption and savings over the last three years. In this post, we analyze responses of student loan borrowers to special questions in the August 2023 SCE Household Spending Survey designed to gauge the expected impact of the payment resumption on future spending growth, the risk of credit delinquency for borrowers, and the economy at large. The findings suggest that the payment resumption will have a relatively small overall effect on consumption, on the order of a 0.1 percentage point reduction in aggregate spending from August levels, and a (delayed) return of student loan delinquency rates back to pre-pandemic levels. Across groups, we see little variation in spending responses but find that low-income borrowers, female borrowers, those with less than a bachelor’s degree, and those who were not in repayment before the pandemic expect the highest likelihood of missed student loan payments.
October 11, 2023
Spending Down Pandemic Savings Is an “Only‑in‑the‑U.S.” Phenomenon

Household saving soared in the United States and other high-income economies during the pandemic, as consumers cut back on spending while government policies supported incomes. More recently, saving behavior has diverged, with the U.S. saving rate dropping below its pre-pandemic average while saving rates elsewhere have remained above their pre-pandemic averages. As a result, U.S. consumers have been spending down the “excess savings” built up during the pandemic while the excess savings abroad remain untapped. This divergent behavior helps explain why U.S. GDP has returned to its pre-pandemic trend path even as GDP levels in other high-income economies continue to run well below trend.
 RSS Feed
 Follow Liberty Street Economics