


12 posts on "Raji Chakrabarti"
June 28, 2024
Racial and Ethnic Inequalities in Household Wealth Persist

Disparities in wealth are pronounced across racial and ethnic groups in the United States. As part of an ongoing series on inequality and equitable growth, we have been documenting the evolution of these gaps between Black, Hispanic, and white households, in this case from the first quarter of 2019 to the fourth quarter of 2023 for a variety of assets and liabilities for a pandemic-era picture. We find that real wealth grew and that the pace of growth for Black, Hispanic, and white households was very similar across this timeframe—yet gaps across groups persist.
December 1, 2023
Recent Disparities in Earnings and Employment

The New York Fed recently released its latest set of Equitable Growth Indicators (EGIs). Updated quarterly, the EGIs continue to report demographic and geographic differences in inflation, earnings (real and nominal), employment, and consumer spending (real and nominal) at the national level. This release also launches a set of national wealth EGIs (which will be examined more closely on Liberty Street Economics early next year). Going forward, EGI releases will also include a set of regional EGIs, which will present disparities in inflation, earnings (real and nominal), employment, and consumer spending (real and nominal) in our region. Drawing on the just released EGIs, in this post, we present recent gender gaps in the labor market at the national and regional levels. We provide a picture of how gender wage and employment disparities have evolved since the pandemic, examining and contrasting gaps at the national and regional level. We find that the gaps between the employment rates and earnings of men and women have declined steadily following the pandemic, but have declined perceptibly more so in our region than in the nation.
Posted at 7:00 am in Demographics, Inequality, New Jersey, New York, Regional Analysis, Unemployment | Permalink
October 18, 2023
Borrower Expectations for the Return of Student Loan Repayment
After forty-three months of forbearance, the pause on federal student loan payments has ended. Originally enacted at the onset of the COVID-19 pandemic in March 2020, the administrative forbearance and interest waiver lasted until September 1, 2023, and borrowers’ monthly payments resumed this month. As discussed in an accompanying post, the pause on student loan payments afforded borrowers over $260 billion in waived payments throughout the pandemic, supporting borrowers’ consumption and savings over the last three years. In this post, we analyze responses of student loan borrowers to special questions in the August 2023 SCE Household Spending Survey designed to gauge the expected impact of the payment resumption on future spending growth, the risk of credit delinquency for borrowers, and the economy at large. The findings suggest that the payment resumption will have a relatively small overall effect on consumption, on the order of a 0.1 percentage point reduction in aggregate spending from August levels, and a (delayed) return of student loan delinquency rates back to pre-pandemic levels. Across groups, we see little variation in spending responses but find that low-income borrowers, female borrowers, those with less than a bachelor’s degree, and those who were not in repayment before the pandemic expect the highest likelihood of missed student loan payments.
July 6, 2023
The EGIs: Analyzing the Economy Through an Equitable Growth Lens
Inflation remains elevated, labor markets are close to the strongest they have been, real consumption is up year-over year, but all of these observations are with respect to averages. Behind these macroeconomic trends can be widely varying experiences across different demographic and socioeconomic groups that make up our society. To provide researchers, practitioners, and the public with timely, regularly updated and comprehensive answers to these questions, we launched the Equitable Growth Indicators (EGIs)—a new tool to help foster the evolving discussion about economic inequality and equitable growth. To illustrate the utility of the EGIs, we provide examples of some striking differences in trends captured in the May release of the EGIs on inflation, real earnings, and real spending. More heterogeneity analysis and data are available at nyfed.org/egi.
May 25, 2023
Do Veterans Face Disparities in the Labor Market—And What Accounts for Them?
We continue our series on military service and consider veterans’ earnings and labor market outcomes. We find that veterans earn more than 12 percent less and are 4 percentage points (18 percent) more likely to be out of the labor force than comparable nonveterans. Interestingly, accounting for veterans’ differences from comparable nonveterans in terms of education and disability status largely explains these labor market differences.
Do Veterans Face Disparities in Higher Education, Health, and Housing?
Veterans are an understudied group that forms an important part of the fabric of American society and that constitutes a significant segment of the population. In the first post of this two-part series, we will investigate how the outcomes of veteran men–in educational attainment, health, and housing–differ from those of comparable men who did not serve in the military. Looking only at men, for reasons described below, we find that relative to nonveteran men with a high school degree and a similar distribution of demographic and geographic characteristics, veterans are 7 percentage points less likely to have a college degree and are over 50 percent more likely to experience a disability. Veterans are also somewhat likelier to rent a home than to own and, as renters, pay a lower average rent, suggesting they experience lower quality housing or live in worse neighborhoods.
January 18, 2023
Rural Households Hit Hardest by Inflation in 2021‑22
To conclude our series, we present disparities in inflation rates by U.S. census region and rural status between June 2019 and the present. Notably, rural households were hit by inflation the hardest during the 2021-22 inflationary episode. This is intuitive, as rural households rely on transportation, and especially on motor fuel, to a much greater extent than urban households do. More generally, the recent rise in inflation has affected households in the South more than the national average, and households in the Northeast by less than the national average, though this difference has decreased in the last few months. Once again, these changes in inflation patterns can be explained by transportation inflation driving a large extent of price rises during 2021 and much of 2022, with housing and food inflation lately coming to the fore.
April 21, 2022
What Might Happen When Student Loan Forbearance Ends?
Federal student loan relief was recently extended through August 31, 2022, marking the sixth extension during the pandemic. Such debt relief includes the suspension of student loan payments, a waiver of interest, and the stopping of collections activity on defaulted loans. The suspension of student loan payments was expected to help 41 million borrowers save an estimated $5 billion per month. This post is the first in a two-part series exploring the implications and distributional consequences of policies that aim to address the student debt burden. Here, we focus on the uneven consequences of student debt relief and its withdrawal. With the end-date of the student loan relief drawing near, a key question is whether and how the discontinuation of student debt relief might affect households. Moreover, will these effects vary by demographics?
Posted at 11:00 am in Credit, Education, Equitable Growth, Household Finance, Pandemic, Student Loans | Permalink
January 12, 2021
Understanding the Racial and Income Gap in COVID‑19: Social Distancing, Pollution, and Demographics
Chakrabarti, Pinkovskiy, and coauthors investigate the extent to which age, pollution, and social distancing factor in to the income and racial gaps in COVID-19 incidence.
July 7, 2020
Introduction to Heterogeneity Series III: Credit Market Outcomes
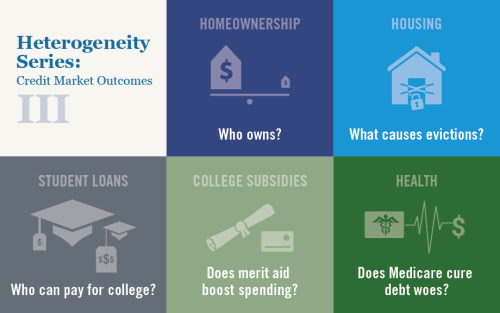
Following up series on heterogeneity and inequality broadly and in labor market outcomes specifically, we turn our focus to further documenting heterogeneity in credit market outcomes, looking at disparities in home ownership rates, varying exposure to evictions, differing gains from tuition support and Medicare programs, and more.
 RSS Feed
 Follow Liberty Street Economics