Housing is by far the most important asset for most households, and, not coincidentally, housing debt dwarfs other household liabilities. The relationship between housing debt and housing values figures significantly in financial and macroeconomic stability, as events during the housing bust of 2006-12 clearly demonstrated. This week, Liberty Street Economics presents five posts touching on various aspects of housing, from the changing relationship between mortgage debt and housing equity to the future of homeownership. In today’s post, we provide estimates of housing equity and explore how vulnerable households are to declines in house prices, using methods introduced in our paper “Tracking and Stress Testing U.S. Household Leverage.”
The extreme price dynamics that hit the housing market in the first decade of the 2000s created wild swings in housing leverage—the ratio of housing debt to housing values. Indeed, the sharp drop in home prices that began in early 2006 caused large numbers of households to lose a significant share of their wealth; in many cases, the leverage ratio for borrowers exceeded 100 percent, meaning that their property was worth less than the mortgage debt. From 2007 to 2011, more than eight million individuals received foreclosure notices, according to the Quarterly Report on Household Debt and Credit, a publication of the New York Fed’s Center for Microeconomic Data. These mortgage defaults played an important role in the destabilization of the financial system that ultimately led to the Great Recession. And the dramatic reduction in equity made it more difficult for many millions of mortgagors to benefit from lower rates, given that the ease (and cost) of mortgage refinance depends on equity.
Measuring Loan-to-Value Ratios for Mortgaged Properties
The key role of household leverage in financial stability and economic growth makes it important to track how leverage is evolving. In our paper on housing leverage, we construct a unique data set and use it to calculate household leverage from 2005 to 2016. Our main data source is Equifax’s Credit Risk Insight Servicing McDash (CRISM), a combination of data on first-lien residential mortgages from Black Knight Analytics (McDash) and matching credit bureau data from Equifax on mortgages and other liens (such as home equity lines of credit and home equity loans). We use weights to ensure that these data match the totals and distributions shown in the nationally representative Consumer Credit Panel. After accounting for the fact that some borrowers have multiple properties, we produce an estimate of the total secured debt on each property.
For our measure of housing value, we take the value of each property at loan origination and update it with the CoreLogic home price indexes at the most detailed geographic level available (mainly zipcode-level). Combining the total secured debt with property value estimates, we construct the combined loan-to-value ratio (CLTV, or the ratio of total secured debt to house value) for each mortgaged property over time.
Results on Leverage
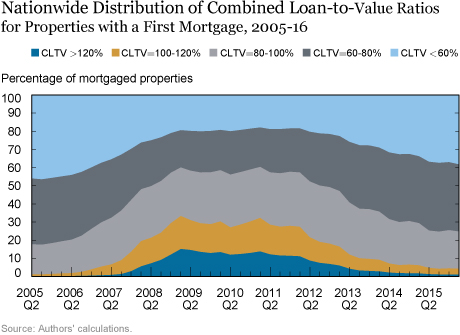
The chart below provides a summary of our results. At each point in time, the colors indicate the distribution of leverage (as measured by the CLTV) for mortgaged properties. (The chart is balance weighted, so it’s best to think of it as representing the share of dollars owed). We can clearly see the effects of the recent large housing market cycle in these data. In early 2005, for example, the light blue area indicates that almost 50 percent of mortgage dollars were secured by a property with a CLTV under 60 percent (that is, the total housing debt owed was less than 60 percent of the value of the property securing it). By the same token, the dark blue and gold areas suggest that only a very small proportion of mortgages were “underwater”—that is, characterized by a leverage ratio above 100 percent.

Home prices began falling in 2006, leading to substantial increases in leverage and a rise in the share of underwater mortgages to more than 30 percent. By late 2008, households had begun reducing their housing debt, but these reductions were insufficient to make a dent in leverage until house prices began rising in 2012. By the first quarter of 2016, the chart looks a lot like it did in 2005-06, with three quarters of the loans secured by properties with CLTVs below 80 percent (the dark gray and light blue areas). Still, some dark blue and gold remain, indicating that the problem of underwater properties has not been totally resolved.
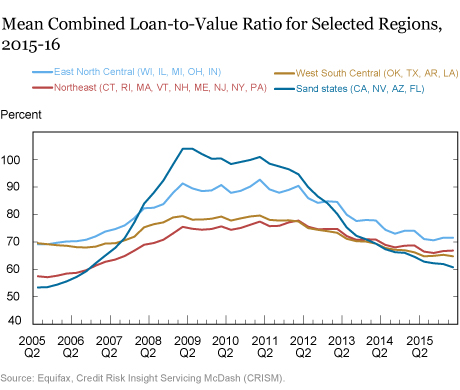
Using information on property location in our data set, we can extend our analysis by breaking out our results by region. The chart below shows the average CLTV for four geographic areas over time. While the housing cycle clearly hit all of these areas, its effects on the “sand states” (Arizona, California, Florida, and Nevada) were most pronounced. In 2005, these states had the lowest leverage levels, with mean CLTVs around 50 percent. The low CLTVs reflected the rapid price increases experienced in the sand states during the boom phase of the housing cycle: even relatively high CLTVs at origination are quickly reduced when prices are rising 40 percent or more per year. When prices fell, however, they fell the most in these same states, leading to sharp increases in leverage that only slowly came down over the subsequent eight years. Other areas’ leverage patterns were similar but less pronounced. For three of the four regions, leverage in 2016 was still higher than it was in 2005. Only in the West South Central states has average leverage fully recovered its 2005 levels. Detailed state-level estimates, reported in our paper along with our regional estimates, indicate that by the first quarter of 2016, more than 10 percent of the properties in Nevada, Rhode Island, Maryland, and Connecticut had mortgages with balances greater than the property’s value.

Stress Tests for the Household Sector
In the final part of our paper, we conduct “stress tests” of the household sector. Like the Dodd-Frank Act stress tests (DFAST) and the stress tests conducted as part of the Comprehensive Capital Analysis and Review (CCAR), our tests assess the resiliency of a given set of loans under adverse economic scenarios. Our object, however, is to test the resiliency of residential mortgages, rather than the resiliency of particular financial institutions.
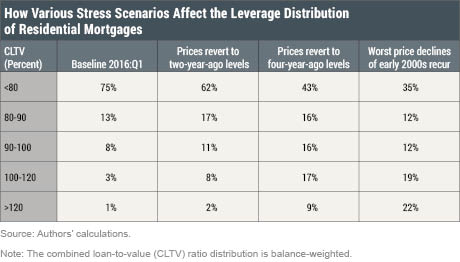
To “stress test” mortgage-borrowing households, we construct scenarios for local house prices and apply them to the stock of loans to see how the distribution of leverage would change. Our house price scenarios include reversals of prices to their levels of two and four years ago, and a recurrence of the largest peak-to-trough price declines experienced during the 2000s (P2T). These scenarios, especially the P2T scenario, generally produce substantial increases in leverage, as shown in the table below, which reports the national CLTV distribution for the baseline and each of the three price scenarios.

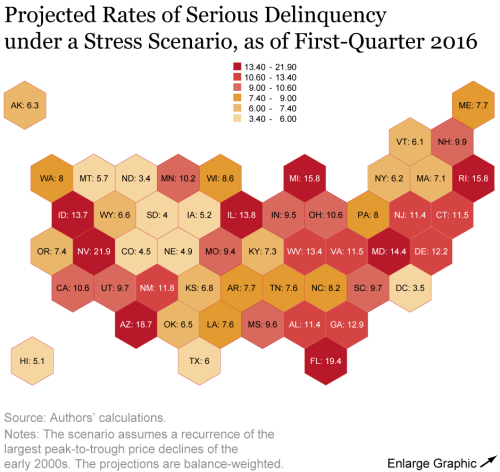
Leverage isn’t the only determinant of loan performance, of course, and in the paper we show how mortgage default is related to both leverage and borrower credit scores (updated credit scores are available in CRISM). We then use these relationships to project how the simulated price declines would affect loan performance over the next twenty-four months, given the current (2016) credit scores of active borrowers. Specifically, we project ninety-plus-day delinquency rates (termed “serious delinquency rates”) as of March 2016 for a baseline scenario with unchanged prices and for the scenarios involving prices returning to their two- and four-year-ago levels. By our estimates, the housing finance system seems likely to be able to withstand a reversal of the last two years’ worth of price growth: such a scenario would cause no state to experience serious delinquency exceeding 10 percent. But a return to the price levels of four years ago would produce serious delinquency rates in the double digits in five states: Arizona, Florida, Georgia, Michigan, and Nevada. A recurrence of the worst declines observed during the financial crisis (P2T) would produce a national serious delinquency rate of 10 percent, and serious delinquency rates of about 20 percent in a few states. The stylized map below shows the results for this last scenario.
Overall, our scenario analyses indicate that the household sector remains vulnerable to severe house price declines, although the high level of creditworthiness among today’s borrowers would serve to mitigate that effect. Going forward, we intend to refine and update these stress tests, so that policymakers, businesses, and households may be better able to assess housing-related vulnerabilities.
Disclaimer
The views expressed in this post are those of the authors and do not necessarily reflect the position of the Federal Reserve Bank of New York or the Federal Reserve System. Any errors or omissions are the responsibility of the authors.
 Andreas Fuster is a research officer in the Federal Reserve Bank of New York’s Research and Statistics Group.
 Eilidh Geddes is a senior research analyst in the Bank’s Research and Statistics Group.
Benedict Guttman-Kenney is a senior economist at the U.K. Financial Conduct Authority.

Andrew F. Haughwout is a senior vice president in the Bank’s Research and Statistics Group.
How to cite this blog post:
Andreas Fuster, Eilidh Geddes, Benedict Guttman-Kenney, and Andrew F. Haughwout, “How Resilient Is the U.S. Housing Market Now?” Federal Reserve Bank of New York Liberty Street Economics (blog), February 13, 2017, http://libertystreeteconomics.newyorkfed.org/2017/02/how-resilient-is-the-us-housing-market-now.html.


 RSS Feed
 Follow Liberty Street Economics
Housing is in a bubble and the bubble is bursting, we see signs of this bursting bubble in the high end markets of London, NY, Hamptons, San Fran and etc. This housing bubble burst will be worse than 2007/8 and along with a significant drop in the Global equity markets, worse than 2007/8, houses will be selling at very deep discounts, one may be able to buy on cents on the dollar, in some areas. As an aside, Deflation is taking hold and Deflation will take its tolls on Debt and Housing.