Rajashri Chakrabarti, Maricar Mabutas, and Basit Zafar
Public colleges and universities play a vital role in training a state’s workforce, yet state support for higher education has been declining for years. As a share of total revenues for America’s public institutions of higher education, state and local appropriations have fallen every year over the past decade, dropping from 70.7 percent in 2000 to 57.1 percent in 2011. At the same time, college enrollment numbers have swelled across the country—public institutions’ rolls grew from 8.6 million full-time students in 2000 to 11.8 million in 2011. Faced with dwindling funding from the states, public institutions of higher education have been forced to find ways to shift their costs or raise revenue on their own. In this post, we analyze the relationship between changes in state and local funding for higher education and changes in public institution tuition.
Data from the State Higher Education Executive Officers (SHEEO) show that, from 2000 to 2010, public funding per pupil, defined as state and local support for public higher education per pupil (excluding loans), fell by 21 percent, from $8,257 to $6,532 (all numbers presented in this post have been adjusted for inflation and reported in 2011 dollars; also note that public funding includes federal funds from the American Recovery and Reinvestment Act, ARRA, available since 2009). Funding patterns differ markedly, however, across the states: In 2010, the percentage change in public funding per pupil from the previous year ranged from -18.0 percent to +16.7 percent. For example, while public funding decreased 7.5 percent in New York, it fell 11.6 percent in California. Public funding increased the most in North Dakota (16.7 percent), followed by Texas (6.6 percent).
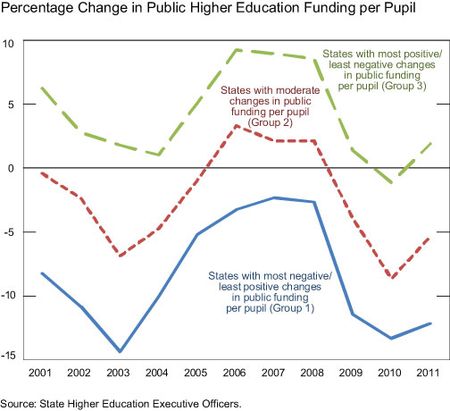
In light of this variation at the state level, we assign each state to a group based on the rate of change in public funding. For each fiscal year from 2001 to 2011, we rank the states based on the percentage change from the previous year in public funding per pupil and categorize them in one of three groups. Group 1 comprises the seventeen states that have the most negative (or least positive) changes in public funding in that year, Group 2 consists of the sixteen states with moderate changes, and Group 3 has the seventeen states that have the most positive (or least negative) changes. In other words, for a given year, states in Group 1 experienced the most unfavorable changes in funding. Since a state is assigned to a group based on changes in public higher education funding in that given year, it may move from one group to another. In fact, forty-seven of the fifty states have been in each of the three groups at some point during the 2001-11 period. For example, while New York placed in Group 3—the group with the most favorable changes in public higher education funding—during 2005-08 when funding grew by about 6 percent on average each year, it moved to Group 1 in 2008 when it experienced funding growth of only 0.36 percent. It then returned to Group 3 in 2009 when it experienced a 1.3 percent decline in funding (compared with a national decline of 5.7 percent).
The chart below illustrates the average percentage change in funding per pupil by group. It is remarkable that, on average, in every year during the 2001-11 period, at least a third of the states experienced funding cuts, and in more than half of those years, two-thirds of the states did. Moreover, aggregate directional trends are roughly the same across all groups, with a constant gap of about 13 percentage points between Group 1 and Group 3 states. As seen in the chart, the distribution of funding changes shifts upward significantly during 2005-08, the boom years, and then shifts downward during the recession years. In fact, since 2008, total public funding for higher education has declined by 14.6 percent.
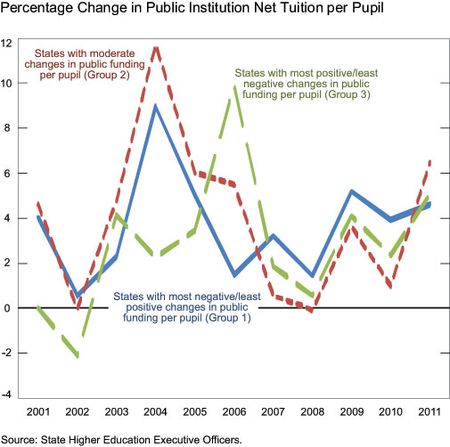
Next we look at changes in tuition at public institutions over the same time period. From 2000 to 2010, real net average tuition at public universities and colleges rose by 33.1 percent, from $3,415 to $4,546. To find out whether changes in public institution tuition vary systematically with changes in public funding, we plot in the chart below the average percentage change in public institution tuition per pupil for each of the three public funding groups.
Before 2007, changes in public institution tuition do not appear to vary closely with public funding. In fact, over the 2000-07 period, a 10 percent decline in state higher educational funding is associated with a 0.5 percent increase in public institution tuition. However, after 2007, the group of states with the most funding cuts (Group 1) also has the highest growth in tuition in each year, with an average annual growth rate of 3.4 percent in tuition. Our analysis suggests that over this period, a 10 percent decline in public funding for Group 1 is associated with an average annual increase of 3.1 percent in tuition at public institutions. This compares with an increase of 1.2 percent in public institution tuition for a 10 percent decline in public funding in our full sample over the same period (2007-11). That is, we observe an economically meaningful relationship between public funding and public institution tuition changes but mainly since the recession began and especially for the group of states with larger higher education funding cuts.
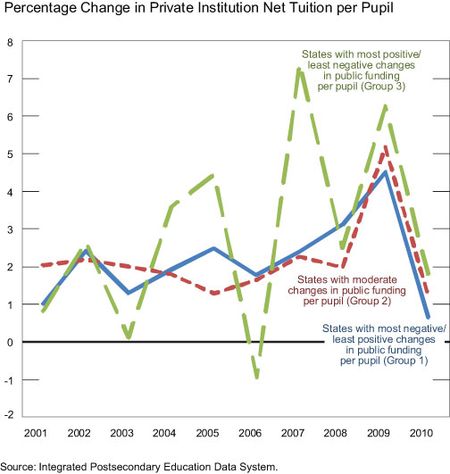
Could there be some unobserved factor that affects both changes in public funding and public institution tuition in a given year in a given state? To explore this possibility, we investigate whether the major trends we see for public institution tuition are also observed for private institution tuition. Our calculations, using the Integrated Postsecondary Education Data System (IPEDS), show that between 2000 and 2010, average net tuition per pupil has grown only about two-thirds as much at private universities and colleges as at public institutions—that is, by 21.2 percent (above inflation). The chart below shows the percentage change in private institution tuition for the three groups of states depicted in the first chart (where groups are defined in terms of changes in public funding). We see that there is no discernible pattern in the change in private institution tuition by group. Whereas public institution tuition grew the most for the group that experienced the most unfavorable changes in public funding, this is not the case with private institution tuition. In fact, decreases in public funding are actually associated with decreases—not increases—in private institutions’ tuition.
In the public discourse, federal funding is often blamed for driving up tuition. However, our analysis suggests that public schools are increasing tuition as a way to make up for decreasing state and local appropriations for higher education, and that deeper cuts in public funding may be associated with correspondingly greater tuition hikes. How much change in public institution tuition is caused by a 1 percent change in public funding is a question that is much harder to answer. The reason is that public institutions can make up for the shortfall in revenues from the states in many ways aside from raising the tuition price: they can lay off instructional, administrative, or other types of staff; or they may even eliminate specific programs from their academic curriculum. Finally, a state school may be inclined to accept a greater proportion of out-of-state students, who pay more in tuition than in-state students; however, additional analysis we conducted fails to find evidence of this over the years 2001-10.
State and local appropriations for public universities and colleges have been declining since 2000, while net tuition at public schools has grown substantially both in real terms and relative to private tuition growth. Our post presents strong suggestive evidence that decreases in state and local appropriations are associated with increases in net tuition at public schools, particularly in recent years. This finding is troubling, since public universities and colleges may face even greater financial strain in the years to come as ARRA federal funding shrinks. For the college student, this means shouldering more of the financial burden, including the possibility of taking out ever larger student loans.
Disclaimer
The views expressed in this post are those of the authors and do not necessarily reflect the position of the Federal Reserve Bank of New York or the Federal Reserve System. Any errors or omissions are the responsibility of the authors.

Rajashri Chakrabarti is an economist in the Regional Analysis Function of the New York Fed’s Research and Statistics Group.
Maricar Mabutas is a former senior research analyst in the Microeconomic Studies Function of the Research and Statistics Group.
 Basit Zafar is an economist in the Microeconomic Studies Function of the Research and Statistics Group.


 RSS Feed
 Follow Liberty Street Economics
The limited variables and time frame for analysis in this study render its conclusions quite limited and less than helpful.
The rate of excessive tuition growth (as defined as the rate above CPI) for 2001 to 2011 is only slightly higher than the rate for the previous 20 years (4% for 1981-2001 vs 4.2% for 2001-2011). Confining the analysis to the period of declines in state support for high ed ignores the fact that the ballooning of that support in the previous 20 years resulted in tuition hikes of a nearly identical magnitude.
. I would imagine there to be a connection between more easily attainable student loans and tuition spikes as well.
I think it would also be interesting to research the effect of easily attainable federal loans to the tuition charged at public and private institutions. I would imagine there to be a connection between more easily attainable student loans and tuition spikes as well.