Since the start of the pandemic, home prices in the U.S. have increased by an astonishing 40 percent. The New York-Northern New Jersey region saw a similar meteoric rise, as home prices shot up by 30 percent or more almost everywhere—even in upstate New York, where economic growth was sluggish well before the pandemic hit. New York City is the exception, where home price growth was less than half that pace. Indeed, home prices actually declined in Manhattan early in the pandemic, though they have rebounded markedly since. Much of the region’s home price boom can be traced to the rise in remote work, which increased the already strong demand for housing at a time when housing inventories were low and declining. Home price increases have largely outpaced income gains through the pandemic boom, resulting in a reduction in housing affordability in the region. However, with mortgage rates rising, it appears that the region’s housing boom is waning, as it is for the nation as a whole, with prices leveling off, though the inventory of available homes remains historically low.
Explosive Home Price Growth
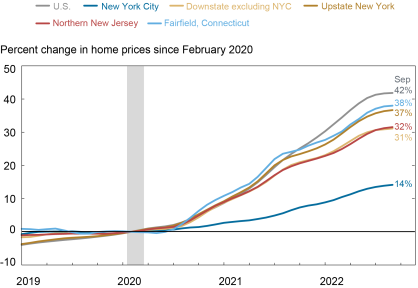
The pandemic led to explosive growth in home prices across the country, with U.S. home prices rising by more than 40 percent in just two and a half years. As shown in the chart below, home prices surged more than 30 percent everywhere in the New York-Northern New Jersey region except in New York City, where they grew at less than half the pace. Perhaps surprisingly, prices grew quite strongly in upstate New York, where economic growth has been sluggish for some time.
The Region’s Pandemic Housing Boom

Note: Shaded area indicates a period designated a recession by the National Bureau of Economic Research.
What Explains the Region’s Housing Boom?
There are a number of reasons home prices increased so dramatically in such a short period of time, both in the nation and the region. First, substantial government support was provided to households early in the pandemic, which contributed to a favorable financial environment. In particular, pandemic relief—including foreclosure and eviction moratoriums—provided support to the housing market during a period of economic contraction when, historically, the housing sector tends to weaken. On top of that, mortgage rates hit historic lows, which provided a boost to housing demand.
In addition, the pandemic fundamentally altered the landscape of housing demand in unexpected ways. Dense urban cores lost some of their luster. Urban amenities that during normal times had been attractive—like bars, restaurants, museums, and public transportation—turned from a blessing to a curse early in the pandemic due to fear of contagion and social distancing. In addition, proximity to urban centers became less important for those who no longer needed to commute to a centrally located job due to the rise in remote work. At the same time, the proliferation of working from home suddenly increased the demand for space, as people looked for larger houses to accommodate spending more time at home. These forces led to a substantial migration of the population toward less dense areas. Regionally, this migration was largely from New York City to its suburbs and beyond, benefitting areas in northern New Jersey, Long Island, the lower and mid-Hudson Valley, and Fairfield County, Connecticut. It also led to increased demand for locations in upstate New York, particularly among remote workers who’d become untethered from their workplaces. Overall, recent research suggests that the increase in housing demand caused by the shift to remote work explains half of the rise in home prices during the pandemic.
All of this occurred during a time of historically low inventory of available homes. Indeed, the homebuilding response to increased demand and higher prices in terms of new construction was muted by worker shortages and supply chain disruptions. Low housing inventory has been particularly severe in upstate New York, which helps explain the significant home price growth experienced there.
A “Donut Hole” in the Middle of New York City
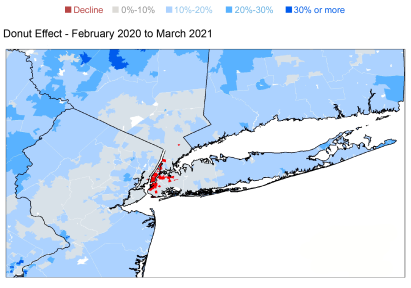
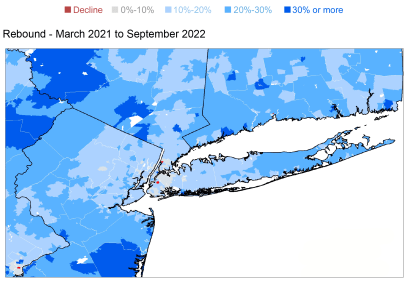
While home prices increased dramatically across most of the region, New York City was the exception. Below are maps of home price changes by zip code in and around New York City during the first year of the pandemic—February 2020 to March 2021—and since then—March 2021 to September 2022. As shown in the top panel, home prices declined in Manhattan and in parts of Brooklyn and Queens, as people left the city early in the pandemic. Indeed, prices fell by more than 20 percent in parts of Lower Manhattan and the Lower East Side. At the same time, home prices increased in the suburbs and outlying areas in the Hudson Valley. This pattern of home price declines in large urban cores coupled with appreciation in the surrounding areas has been termed the “Donut Effect” of COVID-19 on large cities.
Home Prices In and Around New York City


Since then, as shown in the bottom panel, home prices in New York City have largely rebounded. While these maps focus on home prices, two-thirds of New Yorkers are renters. After declining sharply early in the pandemic, rents have also recovered and are now above pre-pandemic levels. All in all, these patterns in home prices and rents point to a revival of the city.
Housing Affordability Has Suffered
With prices rising so rapidly, income gains could not keep pace, reducing housing affordability across the country, an issue that had been a concern in many places even before the pandemic. The chart below shows the ratio of home prices to annual incomes in the U.S. and areas in the New York-Northern New Jersey region. (This ratio is a basic measure of housing affordability that allows for comparisons across space; it does not account for financing costs, which have been increasing with rising mortgage rates.) The U.S. had a home price-to-income ratio of three before the pandemic, which corresponds to a rough rule of thumb that, to be affordable, a home should cost no more than about three years of income. This ratio increased to nearly four in the U.S. during the boom as home price increases swamped income gains.
The Pandemic Boom and Housing Affordability

Housing tends to be far more costly than average across the New York-Northern New Jersey region. And, as in the nation as a whole, housing in the region has become even less affordable through the pandemic, with ratios rising everywhere but New York City, where housing is least affordable. While income gains in New York City kept up with the slower pace of home price appreciation during the boom, the city’s home price-to-income ratio remains more than double the national average. At the other end of the spectrum, upstate New York remains a relatively affordable place to live—which made it attractive during the pandemic—but housing has become less affordable there as well.
A Cooling Market
The housing market has cooled both nationally and regionally as mortgage rates have risen substantially since the beginning of the year, with home prices leveling off or even beginning to decline. Buyers have pulled back and sales activity has softened. It also appears that more sellers are making price cuts to sell their homes. However, inventories remain extremely low, as sellers may be reluctant to give up mortgages at a much lower rate than they can get now. While the dramatic pandemic-era increase in home prices may be ending, the market could remain tight as inventory may remain constrained for some time.
The data underlying the charts in this post, as well as other supplemental materials from our regional economic press briefing, including information for local areas in the Second District, can be found here.

Jaison R. Abel is the head of Urban and Regional Studies in the Federal Reserve Bank of New York’s Research and Statistics Group.

Jason Bram is an economic research advisor in Urban and Regional Studies in the Federal Reserve Bank of New York’s Research and Statistics Group.

Richard Deitz is an economic research advisor in Urban and Regional Studies in the Federal Reserve Bank of New York’s Research and Statistics Group.

Jonathan Hastings is a research associate in the Bank’s Research and Statistics Group.
How to cite this post:
Jaison R. Abel, Jason Bram, Richard Deitz, and Jonathan Hastings, “A Look at the New York‑Northern New Jersey Region’s Pandemic Housing Boom,” Federal Reserve Bank of New York Liberty Street Economics, November 10, 2022, https://libertystreeteconomics.newyorkfed.org/2022/11/a-look-at-the-new-york-northern-new-jersey-regions-pandemic-housing-boom/
BibTeX: View |
Disclaimer
The views expressed in this post are those of the author(s) and do not necessarily reflect the position of the Federal Reserve Bank of New York or the Federal Reserve System. Any errors or omissions are the responsibility of the author(s).


 RSS Feed
 Follow Liberty Street Economics