


Job gains exceeded output growth in 2022, bringing GDP per worker back down to its trend level after being well above for an extended period. Employment is consequently set to grow slower than output going forward, as it typically does. Breaking down the GDP per worker by industry, though, shows a significant divergence between the services and goods-producing sectors. Productivity in the services sector was modestly above its pre-pandemic path at the end of last year, suggesting room for relatively strong employment growth, with the gap particularly large in the health care, professional and business services, and leisure and hospitality sectors. Productivity in goods-producing industries, though, was depressed, implying that payroll growth is set to lag that sector’s GDP growth.
Output by Industry
The first release of GDP data from the Bureau of Economic Analysis looks at output from the demand-side perspective, with output evaluated in terms of expenditures by households, businesses, governments and the rest of the world. Two months later, another set of data is published that breaks down GDP by industry, giving a supply-side view of the economy’s performance. To understand these data, remember that GDP is a value-added concept and is not the same as gross output. The sale of a loaf of bread reflects the gross output of bread, with value-added contributions from both the goods side (manufacturing and agricultural) and services side (retail, wholesale, transportation, and financial, among others.) An individual industry’s GDP is a measure of how that sector’s labor and capital inputs, along with the organization of production, have added value to inputs from other domestic industries and imports.
The chart below divides real GDP into the goods-producing sector (mining, construction, and manufacturing) and private services (wholesale, retail, transportation, warehousing, health care, financial, leisure and hospitality, information, and professional and business services), with the values indexed so that 2019:Q4=100. Before the pandemic, both services and goods-producing sectors grew in line with the whole economy, with both rising at around a 2.5 percent annual rate from 2014-19, while the public sector grew at a 1 percent rate over the same time frame.
The Services Sector Grew Much Faster than the Rest of the Economy during the Pandemic
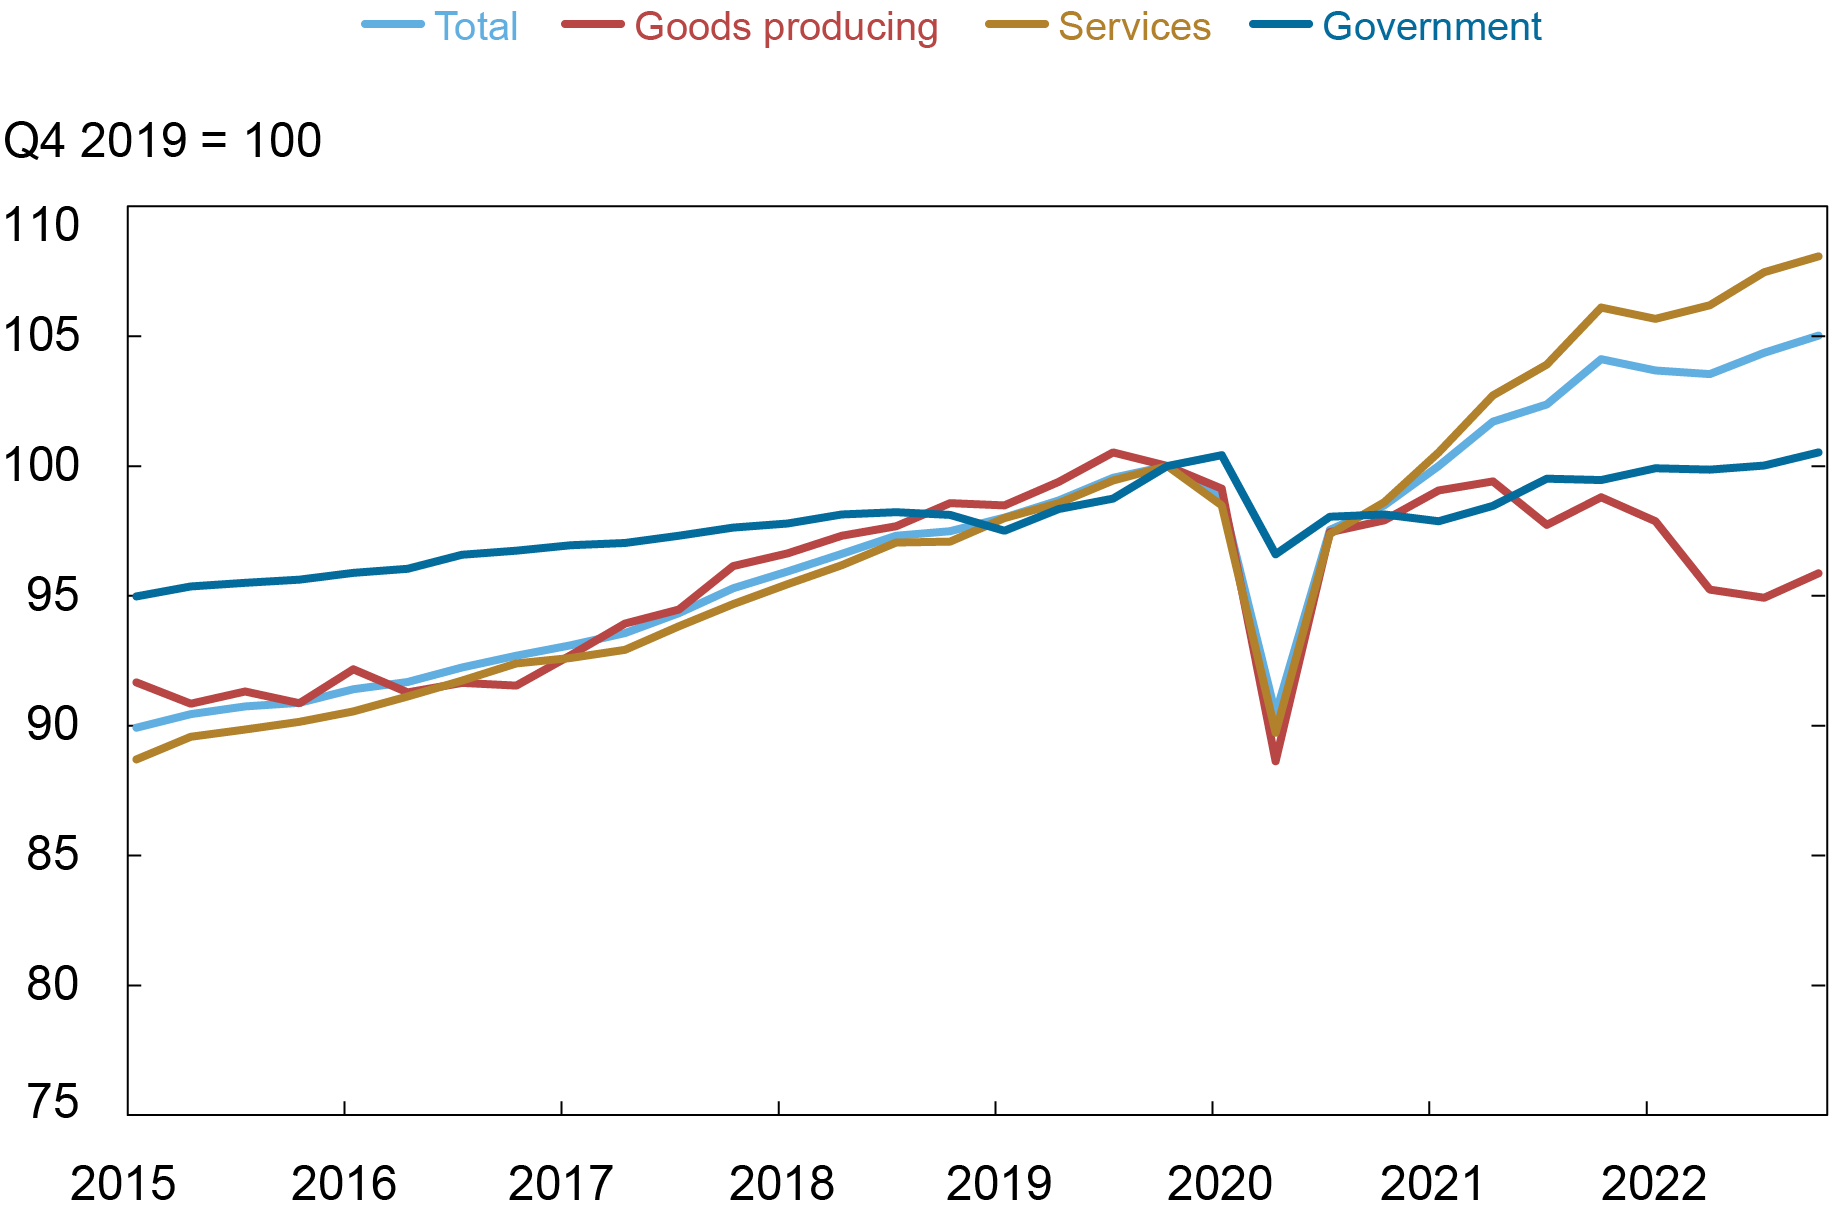
Note: Private services was 70.3 percent of nominal GDP in 2019, the goods-producing sector was 17.5 percent, and government was 12.3 percent.
The chart shows that growth since the start of the pandemic has been essentially limited to the services sector, with flat contribution from the public sector and a decline in output in the goods-producing sector. From 2019:Q4 through 2022:Q4, GDP rose at 1.7 percent annual rate, with the private services sector GDP rising at 2.6 percent rate, the goods-producing output falling at a 1.4 percent rate, and the public sector output rising at a 0.2 percent rate.
The relative strength of the services sector might seem surprising given that there was a large shift in consumer spending to goods and away from services during the pandemic. But consider the how much of the value added behind any goods purchase is supplied by the shipping, wholesale, and retail sectors. This is even more the case when the good is imported instead of produced domestically.
Productivity by Industry
Productivity, measured here by GDP per worker, can be used to evaluate how well employment tracked output during the pandemic period. Industries initially responded to the economy shutting down in the second quarter of 2020 by reducing their workforce and these jobs did not all come back when the economy staged a solid recovery in third quarter. (The focus here is on payrolls, but note that average hours worked increased when the economy rebounded, meaning that output per hour did not rise as much as output per worker in 2020-21. This wedge disappeared over the course of 2022.)
Productivity was flat for the whole economy in 2021 as both payrolls and the economy grew at fast rates. Specifically, output rose 6 percent over the four quarters and payrolls rose 5 percent over the same period. By sector, services output was up 8 percent versus payrolls up 6 percent (higher productivity), goods-producing output was up 1 percent versus payrolls increasing 3 percent (lower), and government output was up 1 percent versus payrolls up 2 percent (lower).
In 2022, overall productivity finally fell as GDP growth slowed to 1 percent while payrolls rose 3 percent. By sector, services GDP grew 2 percent versus payrolls up 4 percent, goods-producing output fell 3 percent versus payrolls up 4 percent, and government output and payrolls both grew 1 percent.
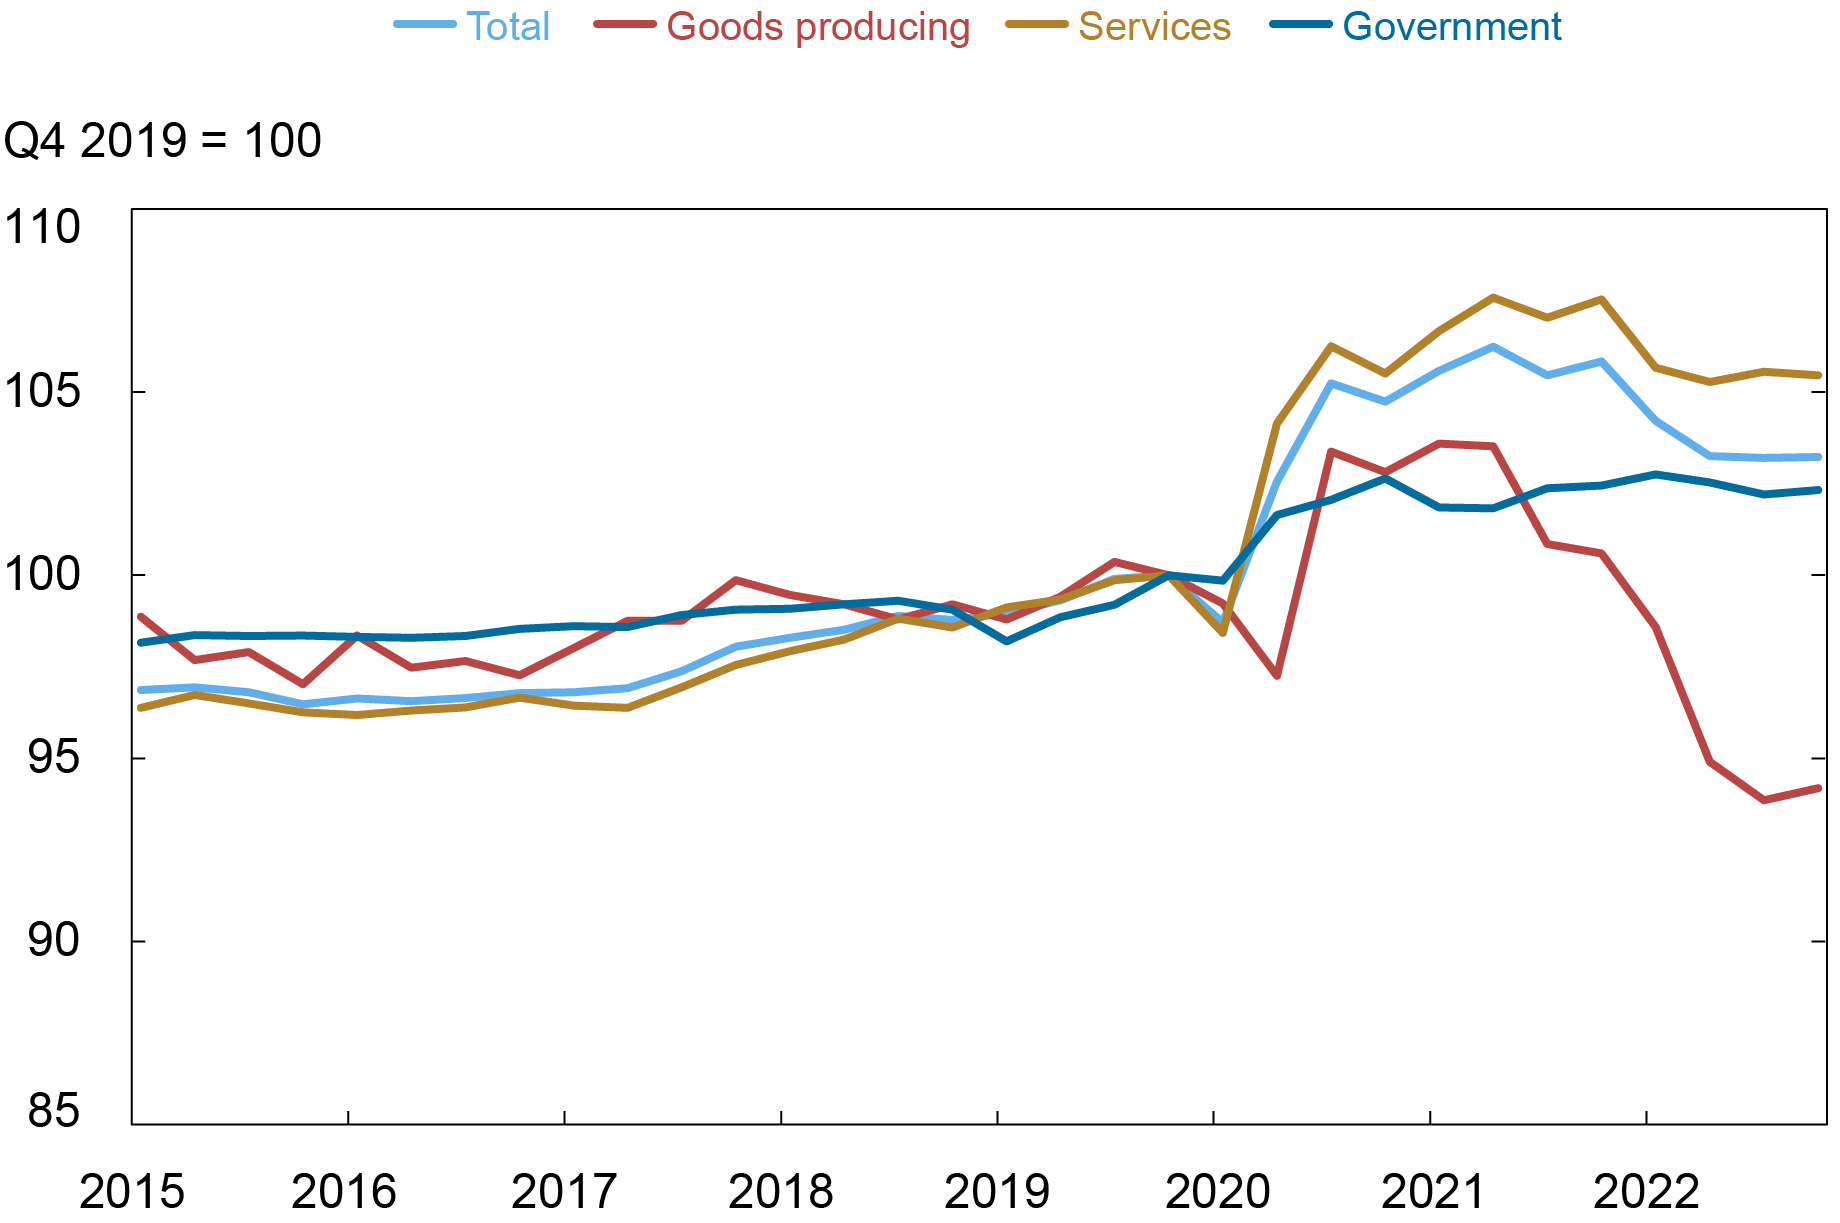
With 2022’s retreat, overall productivity at the end of last year was near or modestly above its trend path, with a positive gap in services offsetting a large negative gap for the goods-producing sector. In services, the gap was largely due to health care, professional and business, and leisure and hospitality services industries, while the depressed productivity for the goods-producing sectors was broad based, with low readings for mining, construction, and manufacturing.
Output per Worker in the Goods-Producing Sector Was Unusually Low at the End of 2022
Payrolls and Output
The combination in 2022 of a steep slowdown of GDP growth and continued robust employment growth brought the level of productivity back down to near its trend path. While GDP-by-industry data are not yet available for 2023:Q1, initial releases have overall payroll growth exceeding output growth, bringing the productivity index in the chart above down by less than half a point. Going forward, this productivity reading suggests that payrolls are poised to go back to growing slower than output, in line with productivity trending up over time.
The industry breakdown shows how this story differs across industries. Services employment has some room to grow above output particularly in the health care, professional and business services, and leisure and hospitality sectors. The outlook is less sanguine for the goods-producing sector, with its productivity well below trend at the end of last year. Firms have hired aggressively even in the face of that sector’s declining GDP. Because of the resulting low level of productivity, employment gains in the goods sector could be quite slow relative to any recovery in its output.

Thomas Klitgaard is an economic research advisor in International Studies in the Federal Reserve Bank of New York’s Research and Statistics Group.

Ethan Nourbash is a research analyst in the Federal Reserve Bank of New York’s Research and Statistics Group.
How to cite this post:
Thomas Klitgaard and Ethan Nourbash, “Assessing the Outlook for Employment across Industries,” Federal Reserve Bank of New York Liberty Street Economics, May 10, 2023, https://libertystreeteconomics.newyorkfed.org/2023/05/assessing-the-outlook-for-employment-across-industries/
BibTeX: View |


Disclaimer
The views expressed in this post are those of the author(s) and do not necessarily reflect the position of the Federal Reserve Bank of New York or the Federal Reserve System. Any errors or omissions are the responsibility of the author(s).
 RSS Feed
 Follow Liberty Street Economics