


The U.S. housing market has had a tumultuous few years. After falling to record lows during the pandemic, the average 30-year mortgage rate rapidly increased in 2022 and 2023 and now hovers near a two-decade high of 7.2 percent. For those that locked in a low mortgage rate prior to 2022, this steep increase has significantly increased the cost of moving, as taking out a mortgage at current rates would potentially increase their monthly housing payment by hundreds or thousands of dollars, even if the amount they borrowed remained unchanged. As shown by Ferreira et al. (2011), this lock-in effect has the potential to reduce geographic mobility and turnover in the housing market and has gained the attention of Federal Reserve leaders. In this post, we utilize special questions from the Federal Reserve Bank of New York’s 2023 and 2024 SCE Housing Surveys to estimate the extent to which mortgage rate lock-in is suppressing U.S. household’s moving plans.
U.S. Homeowners Plan to Stay Put
In considering how mortgage rate lock-in is affecting mobility, it is also worth noting that moving rates are currently quite low in the United States. While declining mobility intensified slightly in recent years, Koşar et al. (2022) show that it is not just a pandemic-era phenomenon. For example, moving rates have been steadily declining for decades and were already below 10 percent in 2019, whereas they were close to 20 percent in the mid-1980s. Frost (2023) shows that switching residences is even rarer for homeowners, whose moving rates have been bound between 5 percent and 10 percent each year since 2006. With such low moving base rates, it is unclear if we should expect mortgage rate lock-in to significantly reduce geographic mobility.
To assess the impact of mortgage rate lock-in on homeowner’s moving plans, we first asked respondents who currently own a home for the percent chance that they will move in the next three years. As shown in the histograms below, U.S. households’ moving plans generally reflect the decline in mobility that we’ve seen in recent decades. Across the distribution of homeowners’ current self-reported mortgage rates, close to half of respondents assess their probability of moving in the next three years to be less than 10 percent, with almost three-quarters of respondents placing their chances at less than 25 percent.
These patterns are broadly consistent across homeowners with and without a mortgage, as all groups report a mean probability of moving in the next three years between 16 percent and 19 percent. Although these comparisons do not take differences of other characteristics between the groups into account, they are suggestive that few U.S. homeowners are planning to move in the next three years and are comparable to the actual rates of annual mobility we reported above.
Distribution of Self-Assessed Probability of Moving in Next Three Years by Current Mortgage Rate
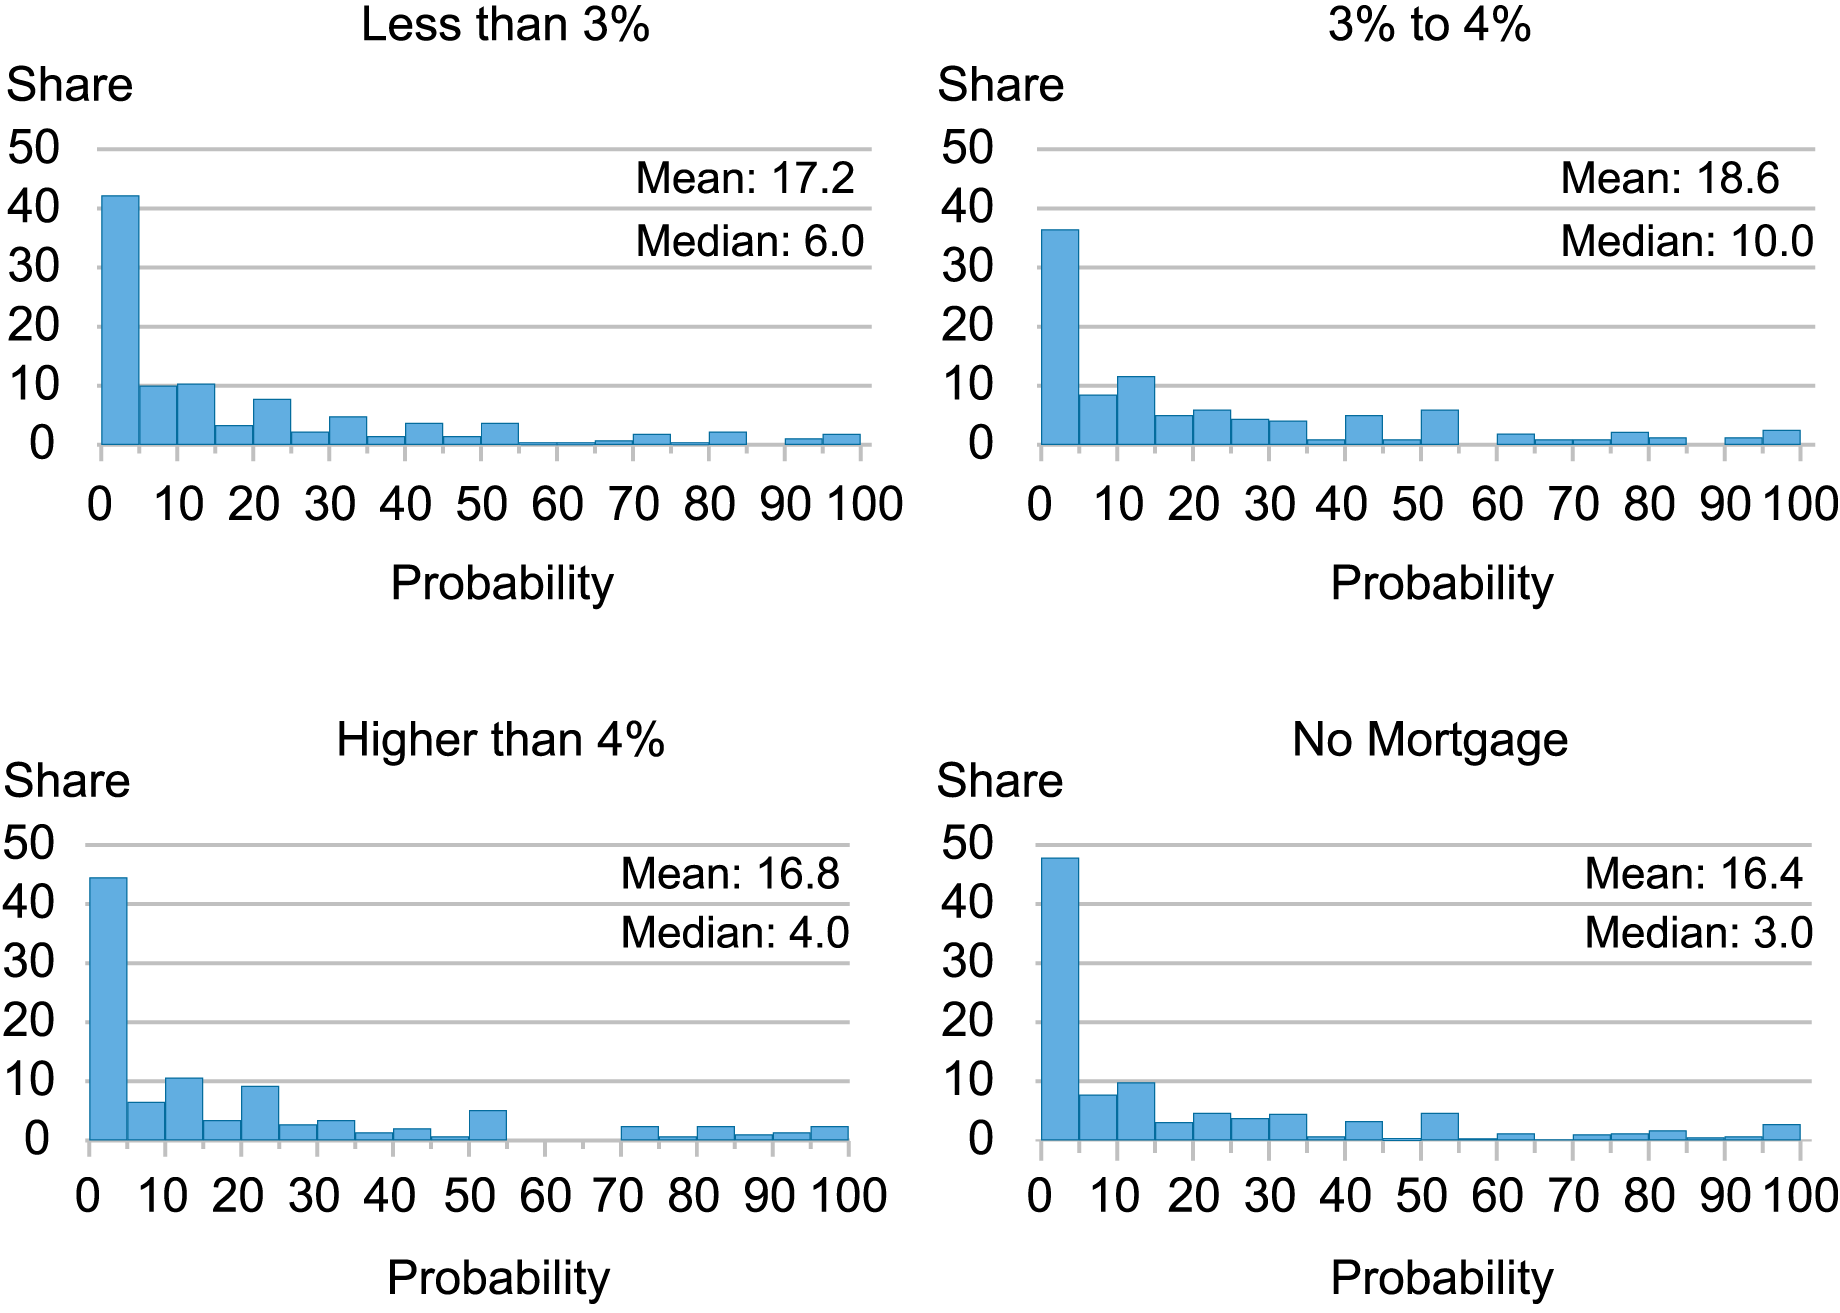
Note: Figures do not include renters.
Estimating the Lock-In Effect
To understand the extent to which the lock-in effect is suppressing household’s moving plans, we presented homeowners with a mortgage with a hypothetical scenario in which they are offered the option to keep their current mortgage rate if they were to move and buy another home. We then asked them for the chance that they would move in the next three years under this scenario.
As shown in the chart below, the ability to keep one’s current interest rate has a significant effect on respondents’ moving plans, as mortgage holders revise their probability of moving upward by 7.4 percentage points on average. This effect is particularly large for those with relatively low mortgage rates, as individuals with rates below 3 percent revise their average probability of moving up from 17.2 percent to 27.7 percent, and those with rates between 3 percent and 4 percent report an increase from 18.6 percent to 26 percent. These differences are both statistically significant and represent 61 percent and 39.8 percent increases respectively.
As one might expect, these revisions decrease monotonically with a respondent’s current mortgage rate, and those with mortgage rates already above 4 percent do not see a statistically significant increase. That said, it is important to note that this result is largely driven by about a quarter of homeowners. In fact, close to half of respondents do not revise their moving probability at all, and about 73.4 percent revise their probability by 10 percentage points or less. We interpret this to mean that mortgage rates are not a primary factor in most respondents’ relocation plans for the next three years but are a large constraint for a relatively small but significant share of homeowners.
Average Probability of Moving in Next Three Years by Current Mortgage Rate
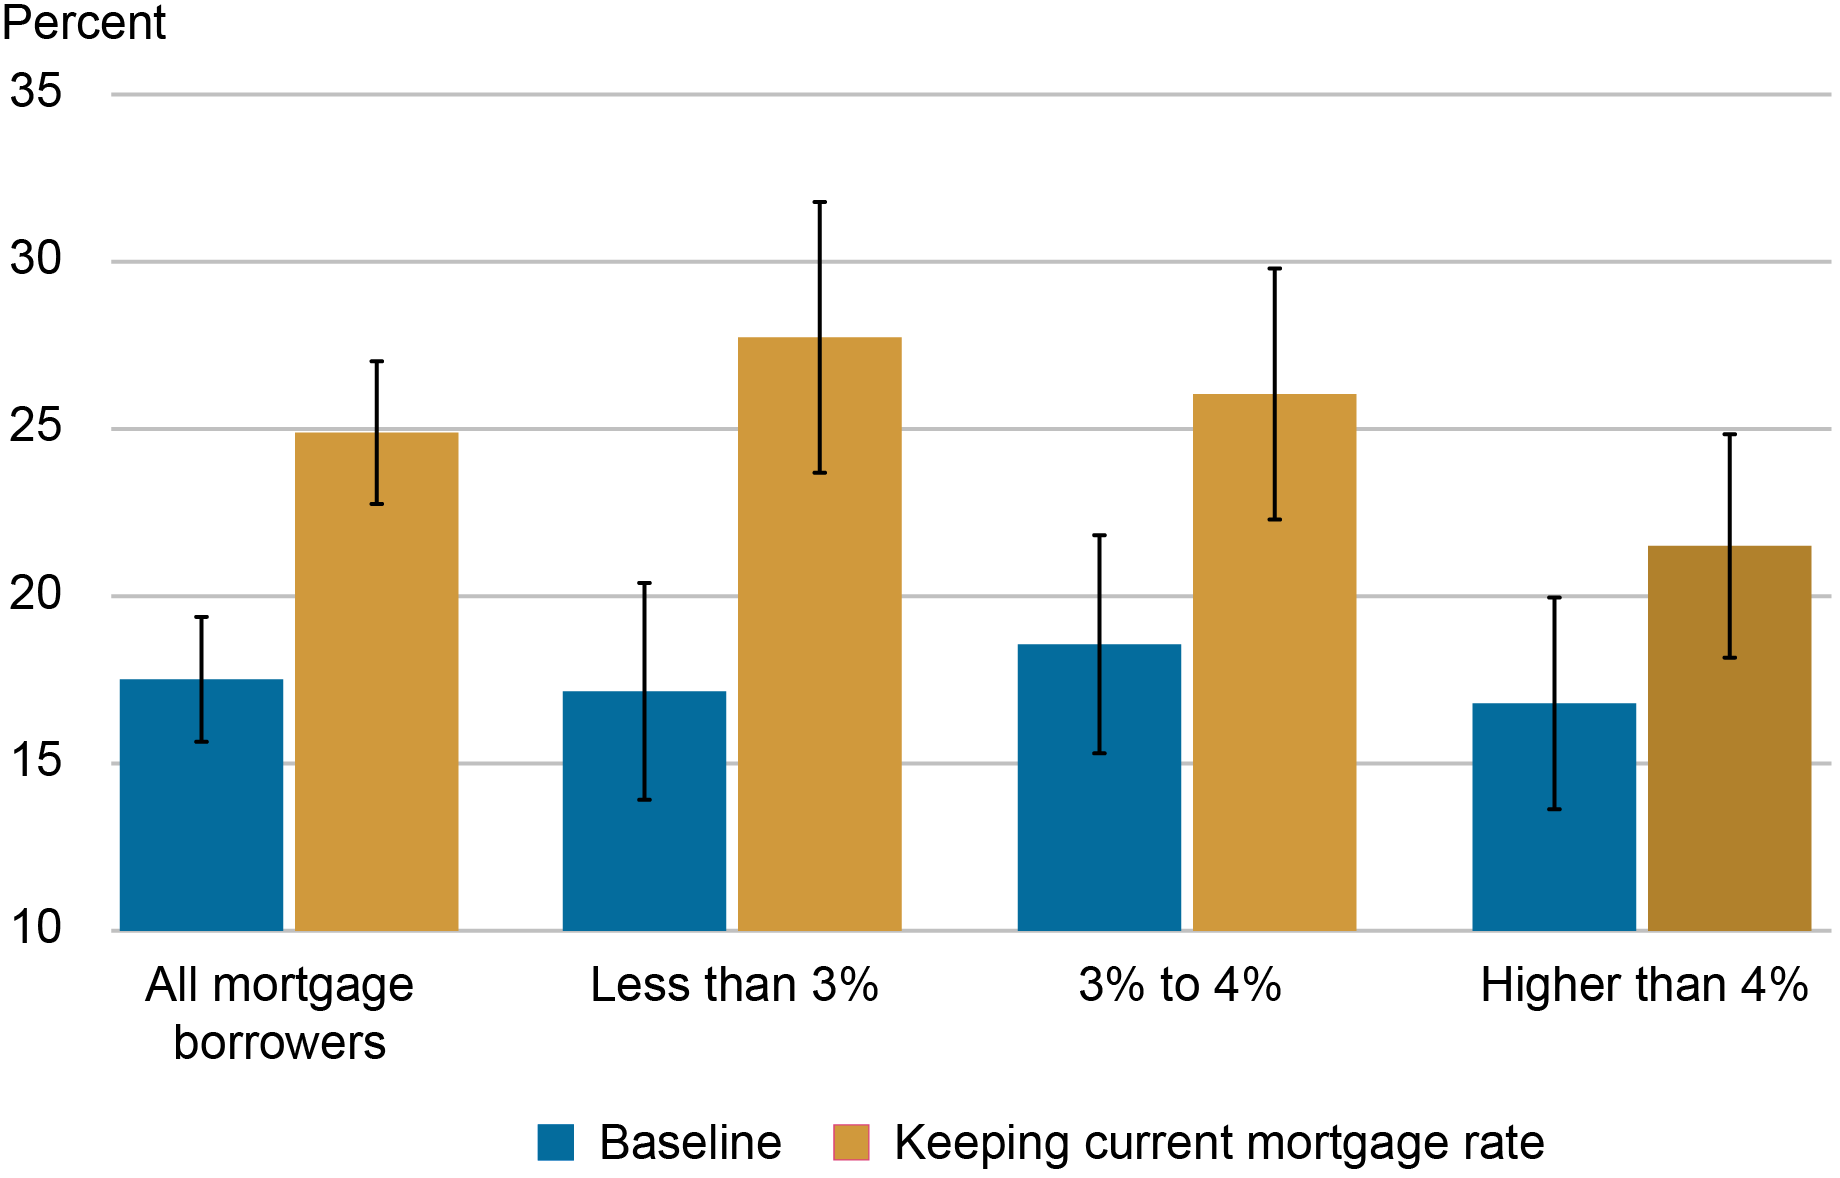
Note: Black bars indicate 95 percent confidence intervals.
Perhaps a more intuitive way to interpret our results is through the lens of a respondent’s perceived mortgage rate gap, which we define as the difference between their perception of the rate they would receive on a new mortgage today, and their current mortgage rate. The chart below shows that the distribution of perceived rate gaps is largely positive, as respondents generally expect that they would need to take out a higher mortgage than they currently have if they were to move. About 9 percent report negative perceived rate gaps, indicating that they believe they could obtain a better rate than they have now. This could indicate that their personal circumstances have changed since they obtained their mortgage. For example, some of these individuals may have recently seen increases in their credit scores.
Distribution of Mortgage Borrowers’ Perceived Mortgage Rate Gaps
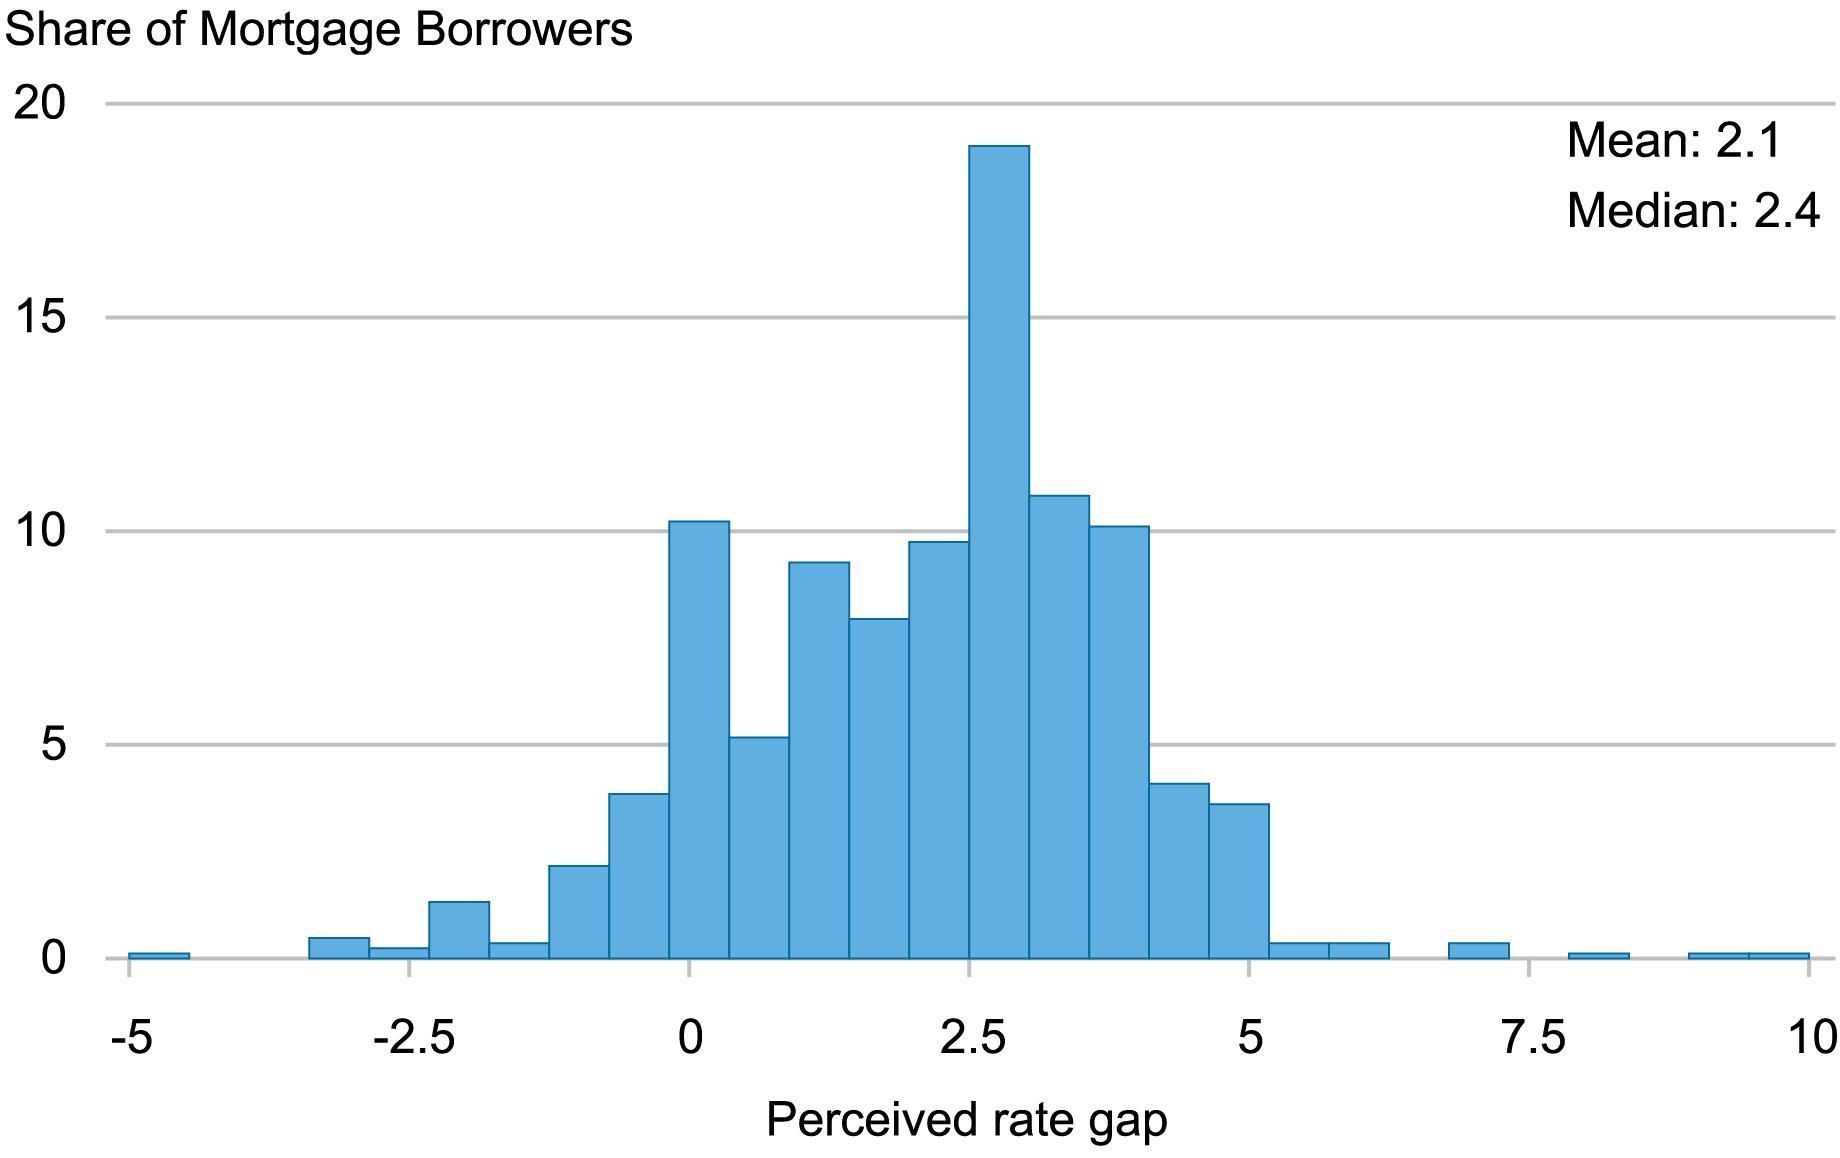
Note: A respondent’s perceived mortgage rate gap is defined as the difference between their perception of the rate they would receive on a new mortgage today and their current mortgage rate.
To put our results in terms of respondents’ perceived rate gaps, consider that at baseline, they report an average probability of moving in the next three years of 17.5 percent, and an average perceived mortgage rate gap of 2.1 percentage points. In our hypothetical scenario, we set their perceived gap to zero percentage points and see their average probability of moving rise to 24.9 percent. If we consider these effects linearly, this implies that a one percentage point decrease in an individual’s perceived mortgage rate gap is on average associated with about a 3.5 percentage point increase in their self-assessed likelihood of moving in the next three years.
Will Reducing Mortgage Rates Increase Mobility?
Private forecasters anticipate that the federal funds rate will decline at some point in the future, with mortgage rates generally expected to follow suit. Our results suggest that these reductions would spur some increase in relocations. That said, most homeowners in our survey do not seem to be making their moving plans based on mortgage rates. For those who are, the effect of rate cuts on their mobility will ultimately depend on their beliefs about the rate they would qualify for on a new home. Indeed, understanding how households form perceptions of the housing market will be an exciting area of research going forward, and important to understanding the extent to which the lock-in effect reduces mobility.

Felix Aidala is a research analyst in the Federal Reserve Bank of New York’s Research and Statistics Group.

Andrew F. Haughwout is director of Household and Public Policy Research in the Federal Reserve Bank of New York’s Research and Statistics Group.

Ben Hyman is a research economist in Urban and Regional Studies in the Federal Reserve Bank of New York’s Research and Statistics Group.

Jason Somerville is a research economist in Consumer Behavior Studies in the Federal Reserve Bank of New York’s Research and Statistics Group.

Wilbert van der Klaauw is an economic research advisor on Household and Public Policy Research in the Federal Reserve Bank of New York’s Research and Statistics Group.
How to cite this post:
Felix Aidala, Andrew Haughwout, Ben Hyman, Jason Somerville, and Wilbert van der Klaauw, “Mortgage Rate Lock‑In and Homeowners’ Moving Plans,” Federal Reserve Bank of New York Liberty Street Economics, May 6, 2024, https://libertystreeteconomics.newyorkfed.org/2024/05/mortgage-rate-lock-in-and-homeowners-moving-plans/
BibTeX: View |


Disclaimer
The views expressed in this post are those of the author(s) and do not necessarily reflect the position of the Federal Reserve Bank of New York or the Federal Reserve System. Any errors or omissions are the responsibility of the author(s).
 RSS Feed
 Follow Liberty Street Economics