U.S. household debt balances grew by $147 billion (0.8 percent) over the third quarter, according to the latest Quarterly Report on Household Debt and Credit from the New York Fed’s Center for Microeconomic Data. Balances on all loan products recorded moderate increases, led by mortgages (up $75 billion), credit cards (up $24 billion), and auto loans (up $18 billion). Meanwhile, delinquency rates have also risen over the past two years, returning to roughly pre-pandemic levels (and exceeding them in the case of credit cards and auto loans), though there are some signs of stabilization this quarter. Are rising aggregate debt burdens sustainable? Or is this expansion to be expected given increases in aggregate income and population size? In this post, we take a look at debt balances scaled by income, tracking the evolution of this ratio over the past twenty-five years.
Note: The Quarterly Report and this analysis are based on the New York Fed Consumer Credit Panel (CCP), drawn from Equifax credit reports.
How High Are Debt Balances?
Since we are interested in the sustainability and affordability of household debt in the overall economy, we choose here to examine the ratio of debt balances to disposable personal income (DPI), defined as aggregate nominal annual income available for spending after taxes; we express our ratio as percentage terms. (Our measure uses the level of debt rather than the cost of servicing debt. The Federal Reserve Board produces data on debt service costs as a share of personal income.)
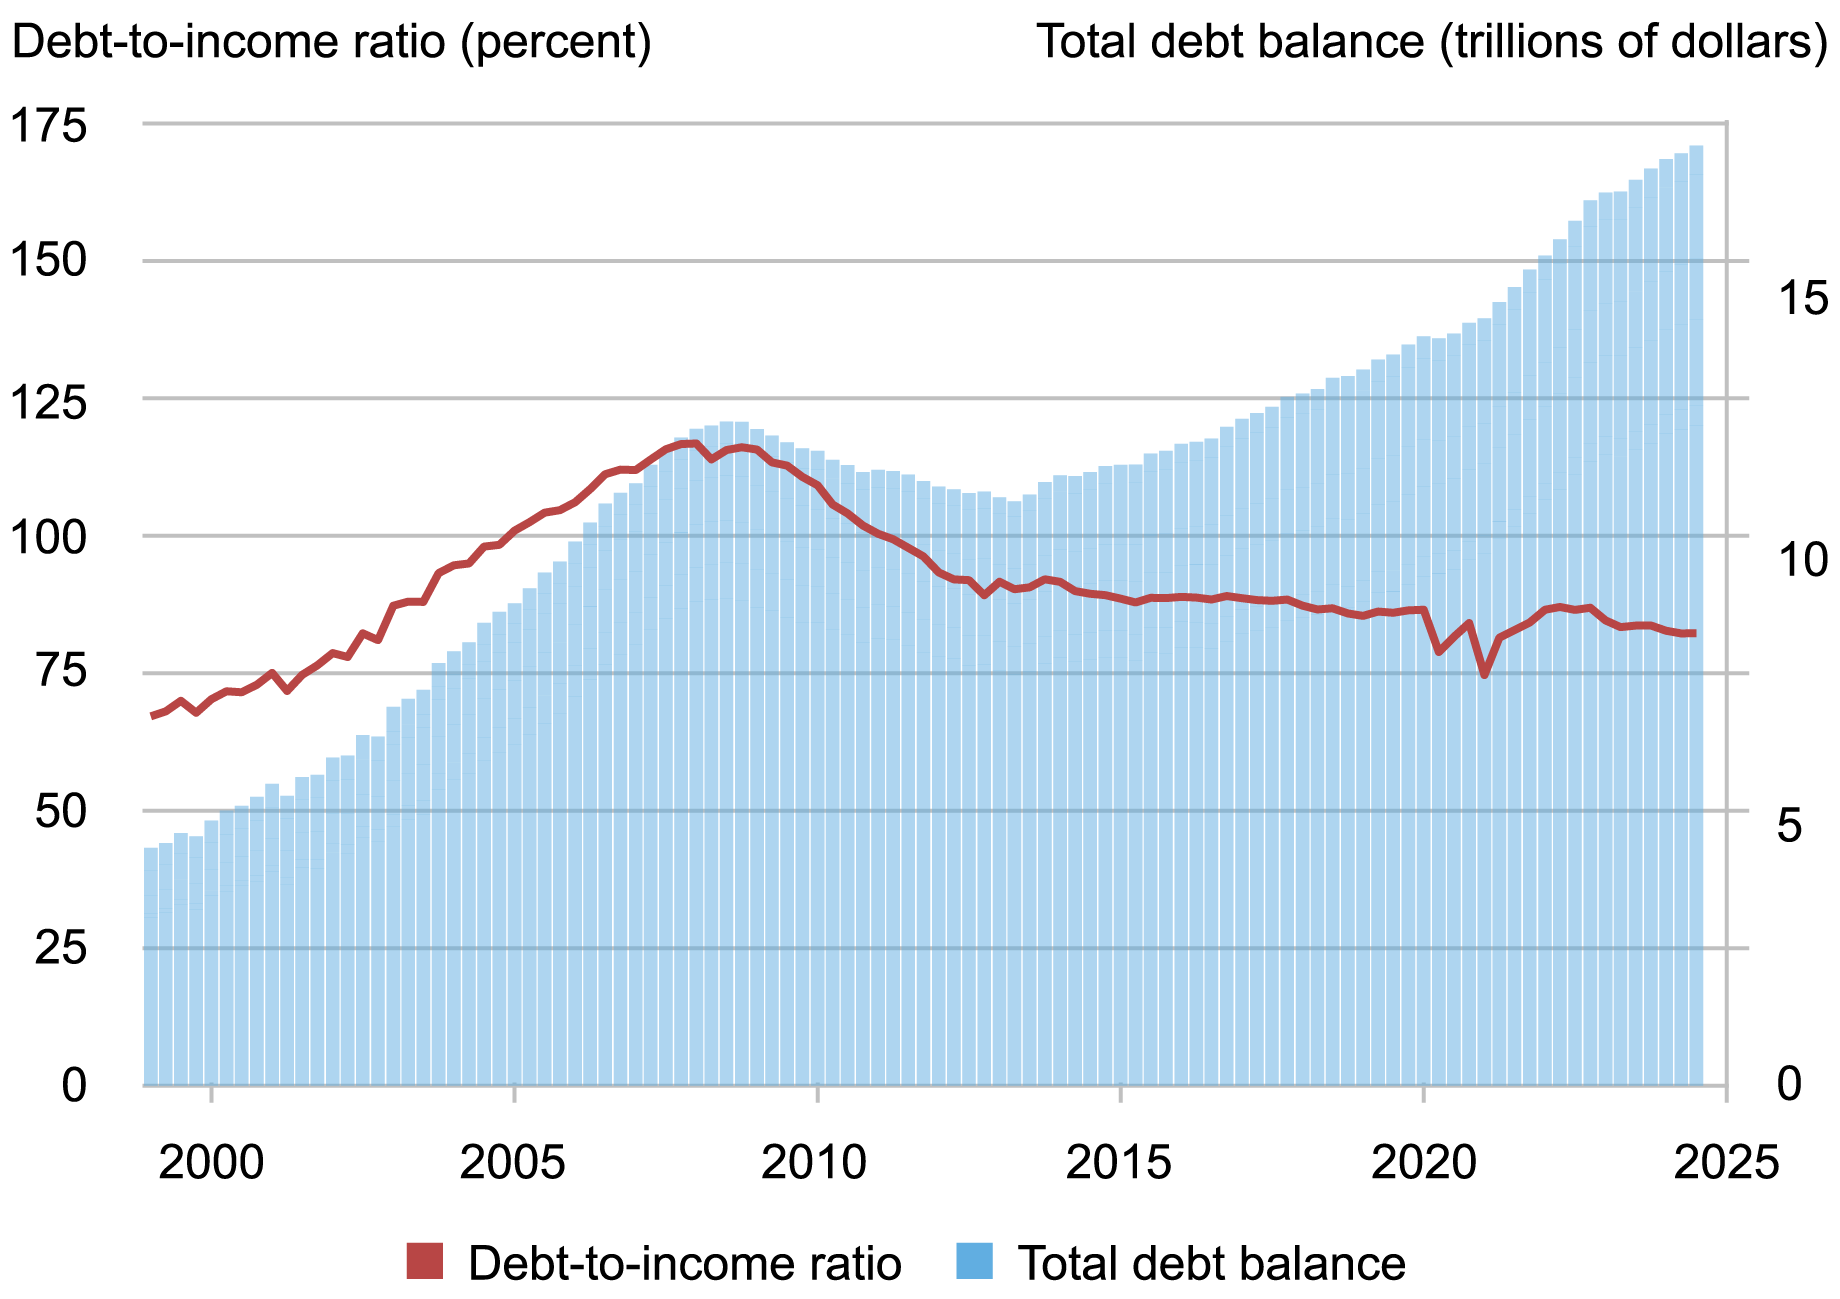
The aggregate debt balance has continued to climb since the pandemic, reaching $17.94 trillion in the third quarter of 2024. However, during this same time, Americans’ disposable personal income has grown as well, reaching a value of $21.80 trillion. Now, the ratio of total debt balance to income is 82 percent, just below the pre-pandemic level of 86 percent in 2019. Relative to income, balances are actually lower than they were before the pandemic.
The Aggregate Debt-to-Income Ratio Is Below Pre-Pandemic Levels Despite All-Time Highs in Nominal Consumer Debt

Sources: New York Fed Consumer Credit Panel / Equifax; Bureau of Economic Analysis.
Now we look at the evolution of the debt-to-income ratio over the business cycle. During the period leading up to the Global Financial Crisis (GFC), Americans borrowed heavily, and debt balances swelled by an average of nearly 13 percent annually between 2002 and the end of 2007 (the start of the GFC). Meanwhile, during this time, income expanded by only about 5 percent annually—a solid annual growth rate, but not nearly enough to keep up with household borrowing. As the growth in debt balances sharply outpaced the growth in income, the debt-to-income ratio rose rapidly, hitting an unprecedented level of nearly 120 percent in 2008.
During the recession and the years that followed, American borrowers deleveraged, reducing their debt balances substantially faster than their incomes, due both to paydowns of existing debts, reduced borrowing, and charge-offs stemming from foreclosures and bankruptcies. By 2014, the period of deleveraging had concluded. Both income and debt balances grew at a similar, moderate pace, leaving the ratio stable until the volatile pandemic era.
More recently, income growth has averaged a robust 6.2 percent annually, while aggregate debt balances have expanded at just over 4 percent per year. This difference has induced some downward movement in the debt-to-income ratio over the last two years. (Note that the debt-to-income measure suddenly decreases in two periods during the pandemic, 2020:Q2 and 2021:Q1. These falls were caused by the sudden increases in income due to stimulus checks [increase in the denominator] and were not caused by sudden drops in the debt [decrease in the numerator]. The same applies to all the charts below as well.)
How the Composition of Household Debt Drives the Ratio
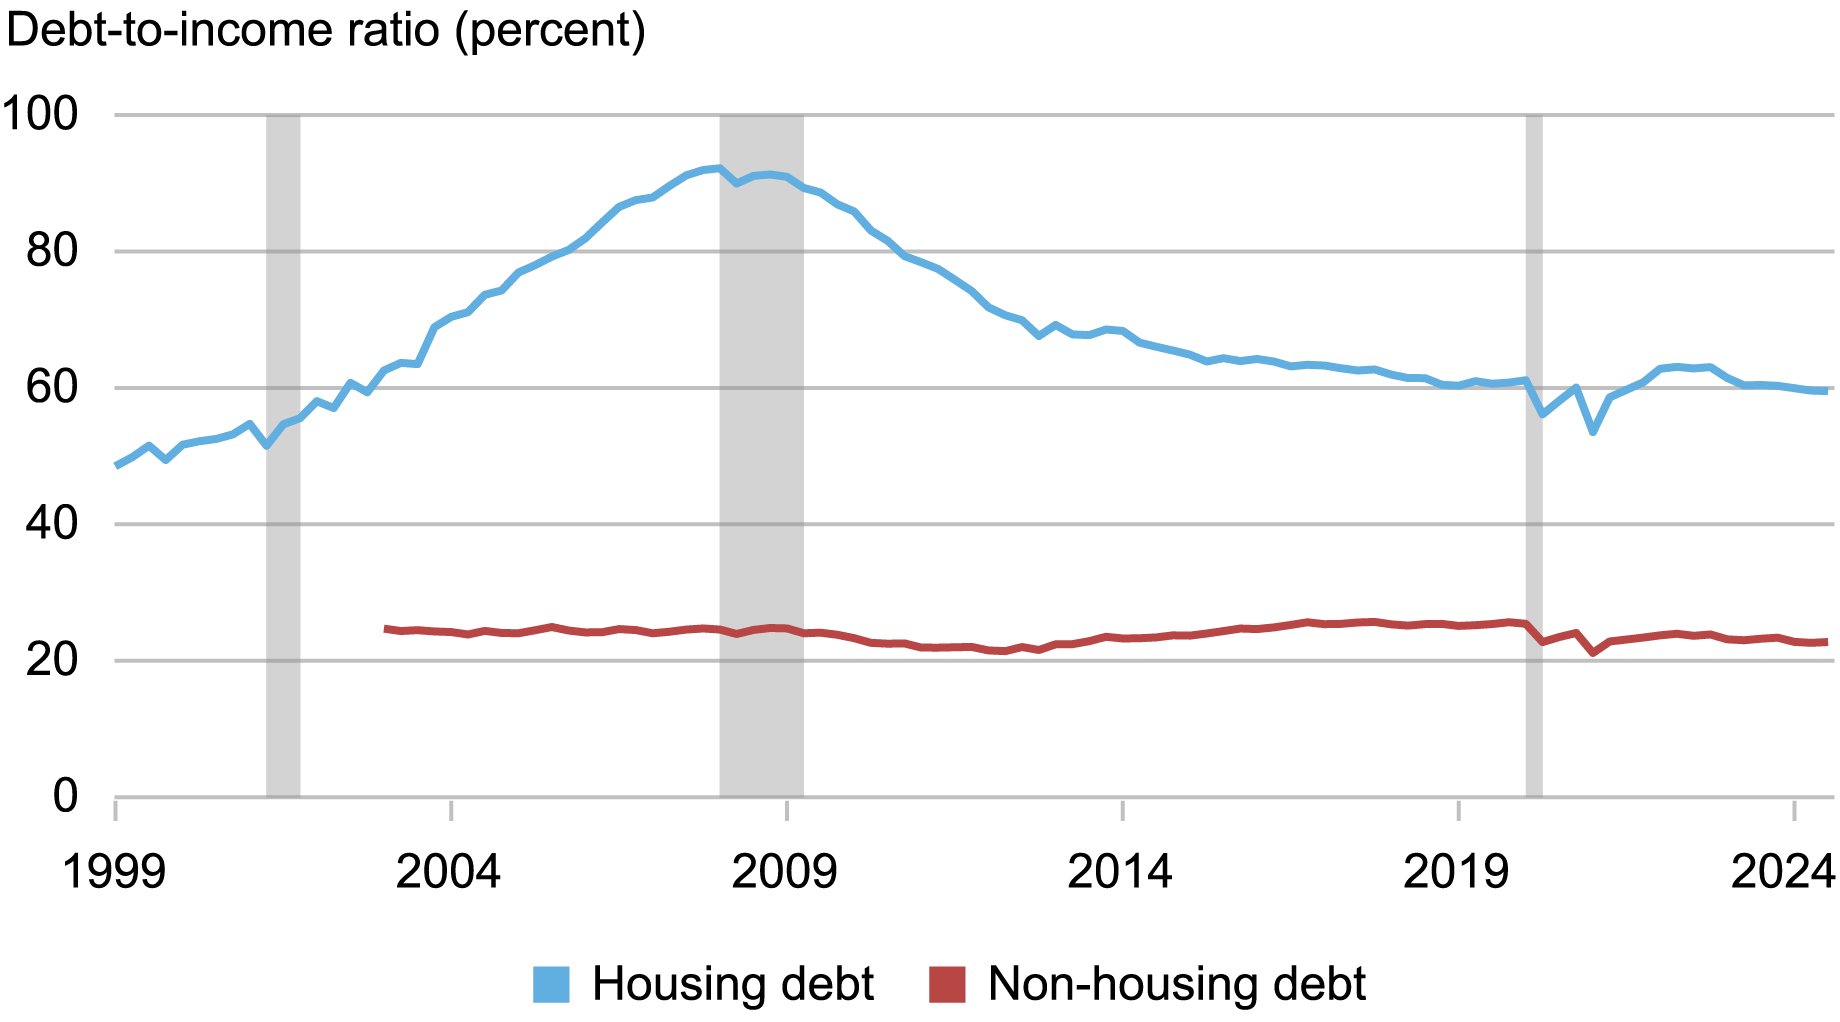
As mortgage balances make up 70 percent of total household balances, this larger trend is mostly driven by mortgages. In the chart below, we disaggregate these debt-to-income ratios into housing-related balances (mortgages and home equity lines of credit) and non-housing balances (credit cards, auto loans, student loans).
Disaggregating this into different debt products reveals different dynamics. Mortgages, which dominate household debt balances, saw a fast rise during the run-up to the GFC—and a subsequent decline during the recession and ensuing fallout. Non-housing balances make up a smaller share of debt, at around 30 percent, and the ratio of non-housing balances to income shows much smaller movements over the business cycle.
These components also have significantly different impacts on household budgets; mortgages are larger, but are paid over longer terms—usually fifteen or thirty years. Non-housing debts tend to have shorter repayment periods, so while these balances are smaller, they may account for a disproportionately larger piece of monthly household budgets. For example, assuming a 6 percent interest rate, a $50,000 auto loan with a four-year term would have nearly the same payment as a $200,000 mortgage with a thirty-year term—both being just under $1,200 per month. These differences in payment burdens are visible in the Federal Reserve Board’s Debt Service Ratios: debt service payments on consumer debts and mortgage balances each account for nearly the same share of income—just under 6 percent.
Income Growth Outpacing Growth in Mortgage Debt

Sources: New York Fed Consumer Credit Panel / Equifax; Bureau of Economic Analysis.
Note: Non-housing data series begins in 2003 due to unavailability of student loan data prior to 2003.
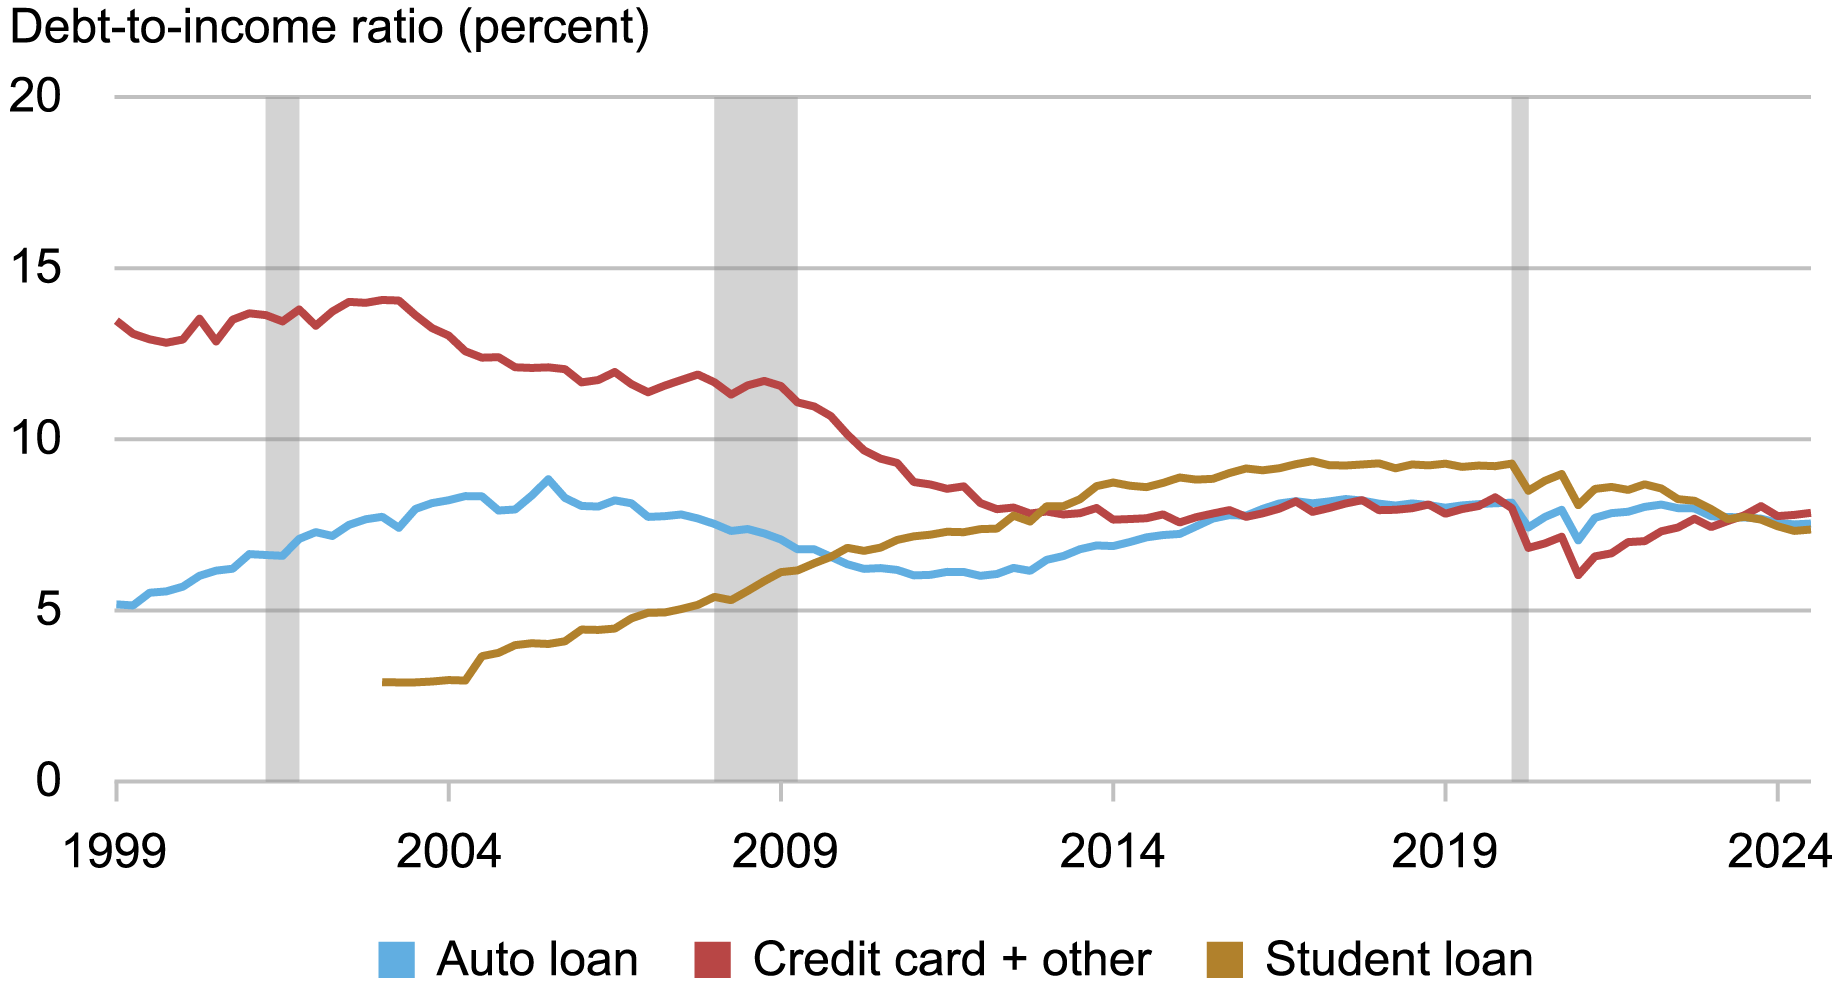
While stable overall, there have been broader movements within the components of non-housing debt. The following chart splits non-housing debt into student loans, auto loans, and credit cards. We include “other” balances with credit card here, as the components—which include retail cards and miscellaneous consumer loans—tend to be consumption-related. Each of these categories has outstanding balances that are quite similar, causing these ratios to converge near 8 percent in recent quarters. Student loans were a relatively small share in the early part of the series but grew steadily; credit card balances declined in share for much of the past twenty-five years, while auto loan balances have been in tighter ranges and have co-moved with the business cycle. Recent movements in the debt-to-income ratio for credit card balances have been consistent with pandemic-era macro conditions, with stimulus-fueled excess savings driving a decrease in credit card balances in 2020-21 and the depletion of those savings sparking a rebound in credit card balances in 2022-24; the latter contributed to strong aggregate consumption in 2023 despite restrictively high interest rates.
Non-Housing Debt-to-Income Ratios Converge, from Divergent Histories

Sources: New York Fed Consumer Credit Panel / Equifax; Bureau of Economic Analysis.
Note: Student loan data are not available until 2003.
Conclusion
Aggregate debt-to-income ratios are a useful rule of thumb to scale household debt at a very macro level—and as we’ve shown here, the overall ratio has declined since the GFC, reflecting the fact that incomes are expanding faster than debts. Still, these aggregate measures don’t necessarily represent what is happening at the household level in terms of borrower income, race, and age. Debts—and incomes—are not distributed evenly over the population. Mortgages are the dominant product in overall debt balances, and shifts in underwriting and lending standards since the GFC have resulted in newly originated mortgages overwhelmingly going to higher-income borrowers with higher credit scores, a group that is relatively older. In fact, measuring the ratio of debt payments to a borrower’s monthly income is a key part of underwriting.
By contrast, non-housing balances may have different, and more varied, impacts on household balance sheets. Lower-income borrowers bearing credit card and auto debt look very different than higher-income households with larger mortgages, while student loan borrowers tend to be younger and in the early stages of their careers. This divergence of debt-to-income measures based on the type of household debt and the heterogeneous characteristics of borrowers might shed light on the economic situations faced by different groups of people in the U.S., particularly when paired with differential movements in delinquency rates. The recent downward movement in the ratio of debt to income has been followed by an apparent moderating of delinquency rates for auto loans and credit cards during the third quarter, and if that trend continues, it would suggest that rising debt burdens remain manageable. But more work is needed to understand the evolution of the burden of debt balances across the population. Such an analysis should also take into account changes on the asset side of household balance sheets, including changes in labor market income and the values of investments, savings, and homes.

Andrew F. Haughwout is director of Household and Public Policy Research in the Federal Reserve Bank of New York’s Research and Statistics Group.

Donghoon Lee is an economic research advisor in Consumer Behavior Studies in the Federal Reserve Bank of New York’s Research and Statistics Group.

Daniel Mangrum is a research economist in Household and Public Policy Research in the Federal Reserve Bank of New York’s Research and Statistics Group.

Joelle Scally is a regional economic advisor in the Federal Reserve Bank of New York’s Research and Statistics Group.

Wilbert van der Klaauw is an economic research advisor on Household and Public Policy Research in the Federal Reserve Bank of New York’s Research and Statistics Group.
How to cite this post:
Andrew Haughwout, Donghoon Lee, Daniel Mangrum, Joelle Scally, and Wilbert van der Klaauw, “Income Growth Outpaces Household Borrowing ,” Federal Reserve Bank of New York Liberty Street Economics, November 13, 2024, https://libertystreeteconomics.newyorkfed.org/2024/11/income-growth-outpaces-household-borrowing/
BibTeX: View |
Disclaimer
The views expressed in this post are those of the author(s) and do not necessarily reflect the position of the Federal Reserve Bank of New York or the Federal Reserve System. Any errors or omissions are the responsibility of the author(s).


 RSS Feed
 Follow Liberty Street Economics
I would like to see this breakdown for those earning 100K or less.