










Monetary policymakers closely monitor the term structure of sovereign bond yields to uncover market participants’ beliefs about the future monetary policy stance, inflation, and activity. A particular object of interest is the natural real rate of return, or “r-star,” which acts as a guide for monetary policy decisions. Numerous papers have questioned how much information investors possess, and how precisely they know r-star. In this post based on a recent Staff Report, we explore what the term structure of interest rates can teach us about r-star and its perception by investors.
Deciphering Long- and Short-Term Fluctuations in Aggregate Macroeconomic Variables
To study this problem, we develop a bond pricing framework that considers a particular kind of incomplete information. We assume that aggregate macroeconomic variables are driven by long-run trends and shorter-lived cyclical movements, which cannot be disentangled by investors in real time. Instead, based on all aggregate macroeconomic variables and some private information, investors infer a decomposition of the aggregates into perceived long- and short-run components.
For instance, suppose investors observe the short-term interest rate at 5 percent. They also observe aggregate inflation and growth, along with the path that led the economy there, and infer a decomposition into 2 percent trend and 3 percent cycle. This decomposition is imperfect in the sense that the true economic states may not match investors’ beliefs, but it is optimal given the information that investors possess.
One general mechanism emerges from this framework. When investors are pricing the term structure of interest rates, they rely on their subjective assessment of the trend and cycle components of the short-term interest rate rather than the true states, unobservable to them. As a result, bond yields reflect the perceived trend and cycle components and policymakers can learn from them as long as investors possess different information than the policymakers. In other words, the term structure of interest rates can only reveal the information that investors can see. In addition, taking the model to the data reveals estimates of the uncertainty that investors encounter about the current state of the economy, notably about r-star.
A Bond Pricing Model in Incomplete Information
We bring this mechanism to a realistic empirical bond pricing model, where investors observe three aggregate macroeconomic variables—namely the interest rate, inflation, and growth—but not their decomposition into short- and long-run components. In line with the macrofinance literature, we consider a finance-based measure of r-star as the spread between the nominal interest rate trend and the inflation trend. In addition, we assume that investors possess some private information that informs them about where the economy is heading in the long run, represented by a factor that is unobserved by the econometrician.
Backing Out Investors’ Uncertainty
Estimated on quarterly yield curve and macroeconomic U.S. data from the 1960s, the model reveals several key features. First, the interest rate, inflation, and growth trends as perceived by investors are slow-moving, but their confidence bands are quite large. Our estimation produces 95 percent confidence bands, which are estimated at ±225 basis points for the nominal interest rate trend i-star, ±125 basis points for the inflation trend pi-star, and ±80 basis points for the growth trend. For instance, at the end of our sample in 2022, i-star is estimated at 3.75 percent by investors, with a 95 percent confidence band of [1.55 percent, 5.95 percent]. This emphasizes the degree of uncertainty that investors meet for estimating the “stars” driving the economy.
What About R-Star?
With the previous time series and parameters, we obtain both subjective investors’ time series of r-star and their uncertainty estimates by looking at the spread between i-star and pi-star. We present the perceived r-star trend in the gold line in the chart below, which shows a remarkably stable path from the 1960s to 2022 between 0 percent and 2.5 percent.
Our estimates are in line with Bauer and Rudebusch 2020 (represented by the green line in the chart), as they are both based on yield curve data. Our trend estimates are also smoother and less volatile than those produced by Laubach and Williams 2003, which are available on the New York Fed’s website and represented in blue in the chart below. However, we also estimate investors’ 95 percent confidence bands of r-star at ±170 basis points, and the Laubach-Williams r-star is within these bands from the 1970s onward.
Investors’ Subjective R-Star Estimates Show Remarkably Low Quarterly Volatility, Large Persistence, and High Uncertainty
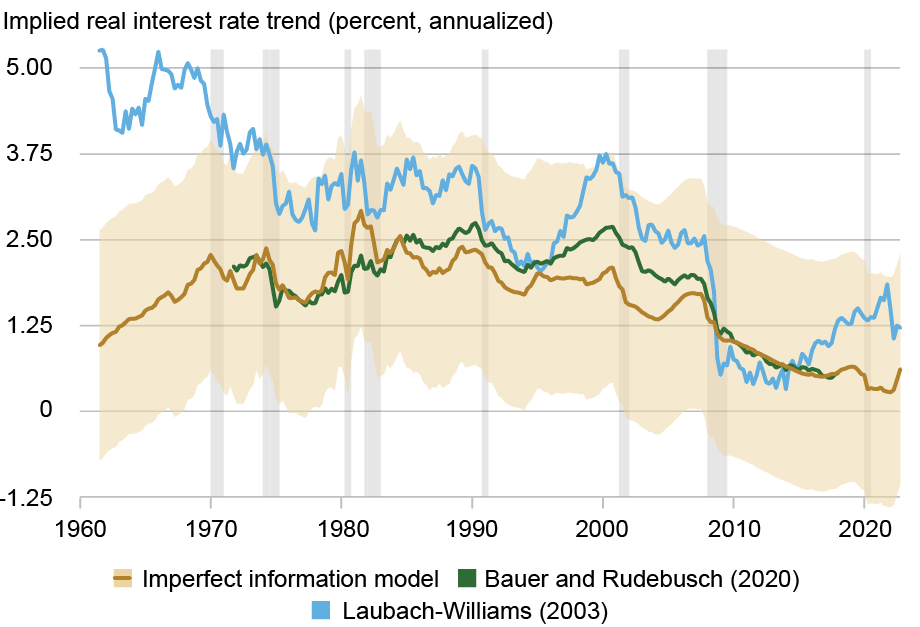
Note: Shaded areas indicate periods designated as recessions by the National Bureau of Economic Research.
Beyond parameters that are estimated on the whole sample (we are assuming that investors know these parameters perfectly), our estimates of perceived r-star are real-time in the sense that investors only rely on information up to time t to produce r-star at time t. We can therefore compare them to other real-time estimates. Due to the nature of our model and the uncertainty that investors are facing, the increase in r-star at the end of our sample is more modest and gradual than what other financial-based estimates and term structure models suggest (see this post for instance) and also casts doubt on the death of the low r-star era.
Last, we complement this analysis by computing the two-sided investors’ r-star estimates, presented in green in the chart below. Two features emerge from the picture. First, uncertainty bands are still as wide as ±130 basis points, reflecting the high degree of uncertainty surrounding r-star even with look-ahead bias. Second, investors’ estimated r-star during the great moderation is lower ex post than in real time, reflecting an ex post evaluation of the monetary policy stance as being more restrictive than perceived at the time.
Investors’ Estimates of R-Star with Knowledge of the Full History from 1960 to 2022 (Two-Sided) Show Little Uncertainty Reduction Compared to Their Real-Time Estimates (One-Sided)
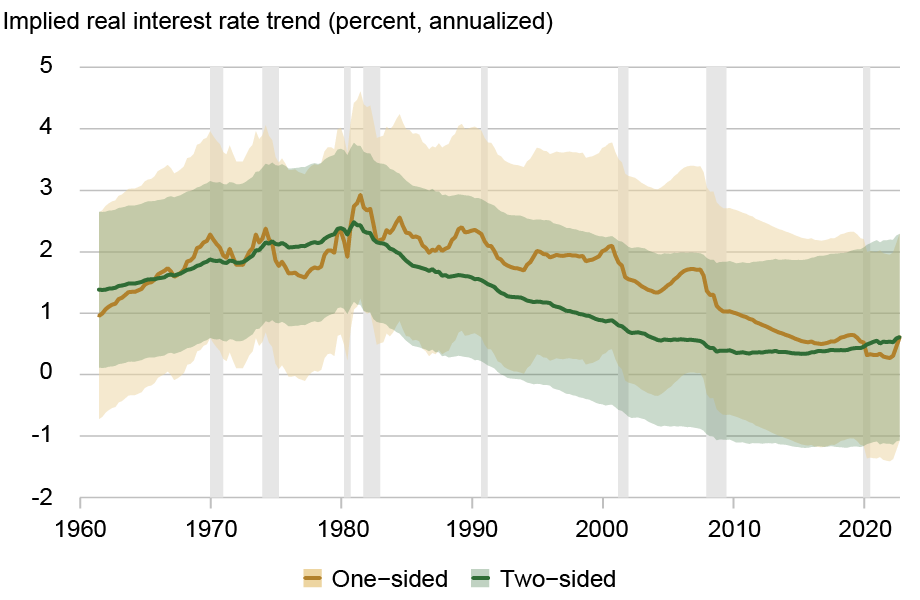
Notes: Both series are based on the imperfect information (II) model. Shaded areas indicate periods designated as recessions by the National Bureau of Economic Research.
Conclusion
The yield curve can reveal valuable information about r-star as perceived by investors, even if investors lack perfect knowledge about the state of the economy in real time. Investors are faced with a large degree of uncertainty that does not disappear over time, which implies that policymakers should consider financial-based estimates of r-star with accompanying uncertainty measures.

Guillaume Roussellet is a financial research economist in the Federal Reserve Bank of New York’s Research and Statistics Group.
How to cite this post:
Guillaume Roussellet, “A Window into Bond Investors’ Uncertainty About R‑Star,” Federal Reserve Bank of New York Liberty Street Economics, August 4, 2026, https://doi.org/10.59576/lse.20260804
BibTeX: View |


Disclaimer
The views expressed in this post are those of the author(s) and do not necessarily reflect the position of the Federal Reserve Bank of New York or the Federal Reserve System. Any errors or omissions are the responsibility of the author(s).
 RSS Feed
 Follow Liberty Street Economics
