


102 posts on "Inequality"
September 6, 2022
How Do Natural Disasters Affect U.S. Small Business Owners?
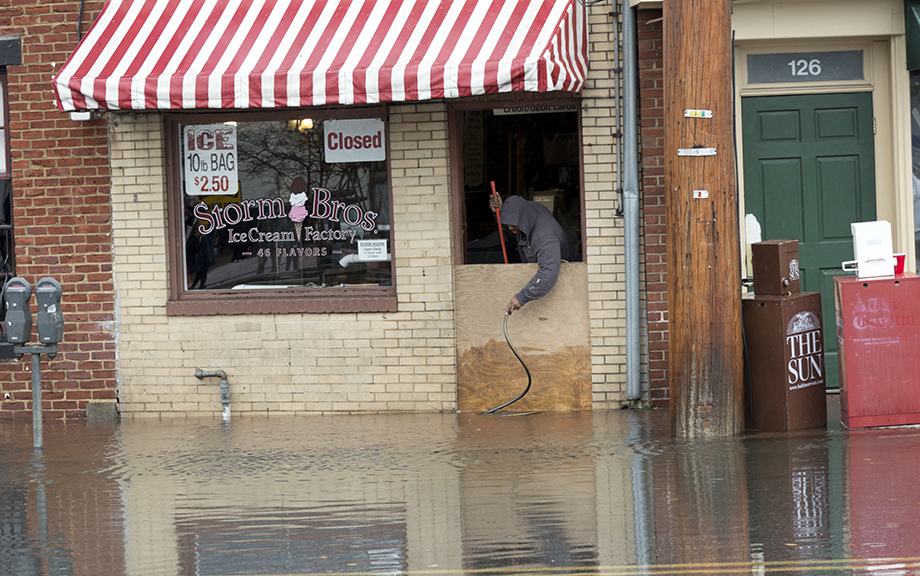
Recent research has linked climate change and socioeconomic inequality (see here, here, and here). But what are the effects of climate change on small businesses, particularly those owned by people of color, which tend to be more resource-constrained and less resilient? In a series of two posts, we use the Federal Reserve’s Small Business Credit Survey (SBCS) to document small businesses’ experiences with natural disasters and how these experiences differ based on the race and ethnicity of business owners. This first post shows that small firms owned by people of color sustain losses from natural disasters at a disproportionately higher rate than other small businesses, and that these losses make up a larger portion of their total revenues. In the second post, we explore the ability of small firms to reopen and to obtain disaster relief funding in the aftermath of climate events.
June 30, 2022
Was the 2021‑22 Rise in Inflation Equitable?
In our previous post, we discussed how the labor market recovery—the “maximum employment” half of the Federal Reserve System’s dual mandate—featured not only a return of overall employment rates to pre-pandemic levels, but also a narrowing of racial and ethnic gaps in employment rates. In this post, we take up the second half of the dual mandate—price stability—and discuss heterogeneity in inflation rates faced by different demographic groups during the rise in inflation in
2021-22. We find that, in contrast to inequalities in employment rates, disparities in inflation rates have widened during the recent inflationary episode, with Black and Hispanic Americans experiencing more inflation.
May 23, 2022
The Adverse Effect of “Mandatory” Flood Insurance on Access to Credit

The National Flood Insurance Program (NFIP) was designed to reduce household and lender flood-risk exposure and “encourage lending.” In this post, which is based on our related study, we show that in certain situations the program actually limits access to credit, particularly for low-income borrowers—an unintended consequence of this well-intentioned program.
Posted at 7:00 am in Banks, Climate Change, Household Finance, Inequality | Permalink | Comments (2)
January 7, 2022
The Effect of Inequality on the Transmission of Monetary and Fiscal Policy
Monetary policy can have a meaningful impact on inequality, as recent theoretical and empirical studies suggest. In light of this, how should policy be conducted? And how does inequality affect the transmission of monetary policy? These are the topics covered in the second part of the recent symposium on “Heterogeneity in Macroeconomics: Implications for Policy,” hosted by the new Applied Macroeconomics and Econometrics Center (AMEC) of the New York Fed on November 12.
Posted at 7:00 am in Equitable Growth, Fiscal Policy, Inequality, Macroeconomics, Monetary Policy | Permalink
January 6, 2022
The Effect of Monetary and Fiscal Policy on Inequality
How does accounting for households’ heterogeneity—and in particular inequality in income and wealth—change our approach to macroeconomics? What are the effects of monetary and fiscal policy on inequality, and what did we learn in this regard from the COVID-19 pandemic? What are the implications of inequality for the transmission of monetary policy, and its ability to stabilize the economy? These are some of the questions that were debated at a recent symposium on “Heterogeneity in Macroeconomics: Implications for Policy” organized by the new Applied Macroeconomics and Econometrics Center (AMEC) of the New York Fed on November 12.
Posted at 7:00 am in Equitable Growth, Inequality, Monetary Policy, Pandemic, Unemployment | Permalink
December 22, 2021
Stimulus, Savings, and Inflation: The Top Five Liberty Street Economics Posts of 2021
New York Fed researchers tackled a wide array of topics on Liberty Street Economics (LSE) over the past year, with the myriad effects of the pandemic—on supply chains, the banking system, and inequality, for example—remaining a major area of focus. Judging by the list below, LSE readers were particularly interested in understanding what comes next: the most-viewed posts of the year analyze households’ use of stimulus payments, the implications of lockdown-period savings, the risk of a new housing bubble, the compression of the breakeven inflation curve, and the potential roles that central banks could play in the digital currency sphere. As the year draws to a close, take a look back at the top five posts of 2021.
November 17, 2021
The Role of Educational Attainment in Household Debt and Delinquency Disparities
This post concludes a three-part series exploring the gender, racial, and educational disparities of debt outcomes of college students. In the previous two posts, we examined how debt holding and delinquency behaviors vary among students of different race and gender, breaking up our analyses by level of degree pursued by the student. We found that Black and Hispanic students were less likely than white students to take on credit card debt, auto loans, and mortgage debt, but experienced higher rates of delinquency in each of these debt areas by the age of 30. In contrast, Black students were more likely to take out student debt and both Black and Hispanic students experienced higher rates of student debt delinquency. We found that Asian students broadly followed reverse patterns from Black and Hispanic students by age 30. They were more likely than white students to acquire mortgages and less likely to hold student debt, but their delinquency patterns were in general similar to those of white students. Women were less likely to hold an auto loan or mortgage and more likely to hold student debt by age 30, and in most cases their delinquency outcomes were indistinguishable from males. In this post, we seek to understand mechanisms behind these racial and gender disparities and examine the role of educational attainment in explaining these patterns.
Posted at 6:02 am in Demographics, Education, Equitable Growth, Household Finance, Inequality | Permalink
Unequal Distribution of Delinquencies by Gender, Race, and Education
This post is the second in a three-part series exploring racial, gender, and educational differences in household debt outcomes. In the first post, we examined how the propensity to take out household debt and loan amounts varied among students by race, gender, and education level, finding notable differences across all of these dimensions. Were these disparities in debt behavior by gender, race, and education level associated with differences in financial stress, as captured by delinquencies? This post focuses on this question.
Posted at 6:01 am in Demographics, Education, Equitable Growth, Household Finance, Inequality, Labor Market | Permalink
Uneven Distribution of Household Debt by Gender, Race, and Education
Household debt has risen markedly since 2013 and amounts to more than $15 trillion dollars. While the aggregate volume of household debt has been well-documented, literature on the gender, racial and education distribution of debt is lacking, largely because of an absence of adequate data that combine debt, demographic, and education information. In a three-part series beginning with this post, we seek to bridge this gap. In this first post, we focus on differences in debt holding behavior across race and gender. Specifically, we explore gender and racial disparities in different types of household debt and delinquencies—for auto, mortgage, credit card, and student loans—while distinguishing between students pursuing associate’s (AA) and bachelor’s (BA) degrees. In the second post in this series, we investigate gender and racial disparities in delinquencies across these various kinds of consumer debt. We close with a third post where we try to understand some of the mechanisms behind differences in debt and delinquencies across gender and race.
August 9, 2021
Unequal Burdens: Racial Differences in ICU Stress during the Third Wave of COVID‑19
A critical risk during the COVID-19 pandemic has been the possibility of the hospital system becoming overwhelmed. COVID-19 not only has killed nearly 2 percent of people with confirmed infections but causes many more who contract it to develop severe complications that are potentially fatal if not treated in an intensive care unit (ICU). As ICU capacity is based on typical needs for intensive care before the pandemic, a surge of COVID-related ICU patients may leave no room for individuals requiring intensive care for other reasons—such as heart attacks—or may exceed the total ICU capacity to treat even COVID-19 patients. In this post, we investigate the extent to which members of different racial and ethnic groups faced different levels of hospital system stress during the “third wave” of COVID-19 in the winter of 2021, which, as the largest wave to hit the United States, briefly brought intensive care units around the country to the point of being overwhelmed. We find that while Black and Hispanic individuals faced the greatest exposure to overburdened ICUs over the course of the third wave from beginning to end, Asian American and Pacific Islanders (AAPI) went from experiencing more stable ICU capacities than the national average at the beginning of the wave to a nearly overwhelmed ICU system at its peak.
 RSS Feed
 Follow Liberty Street Economics