


147 posts on "Pandemic"
January 4, 2022
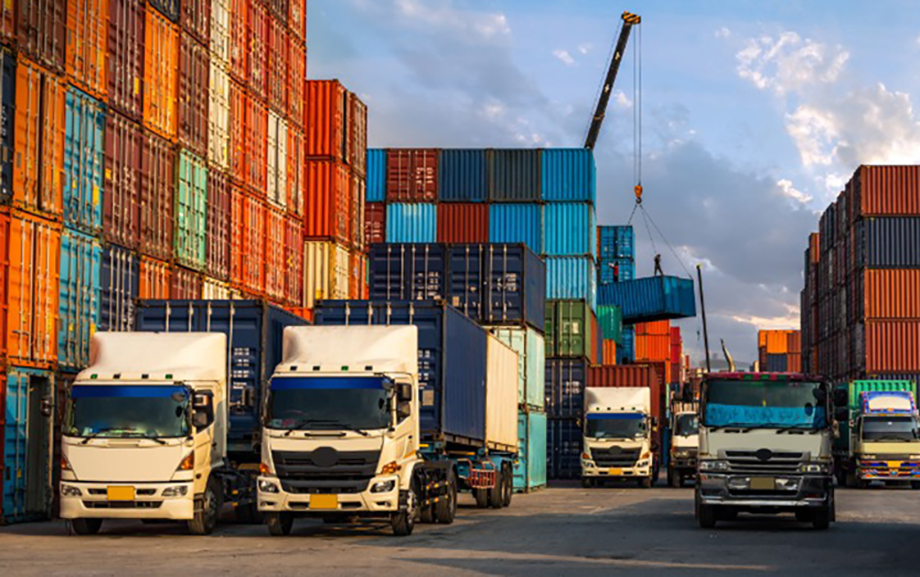
A New Barometer of Global Supply Chain Pressures
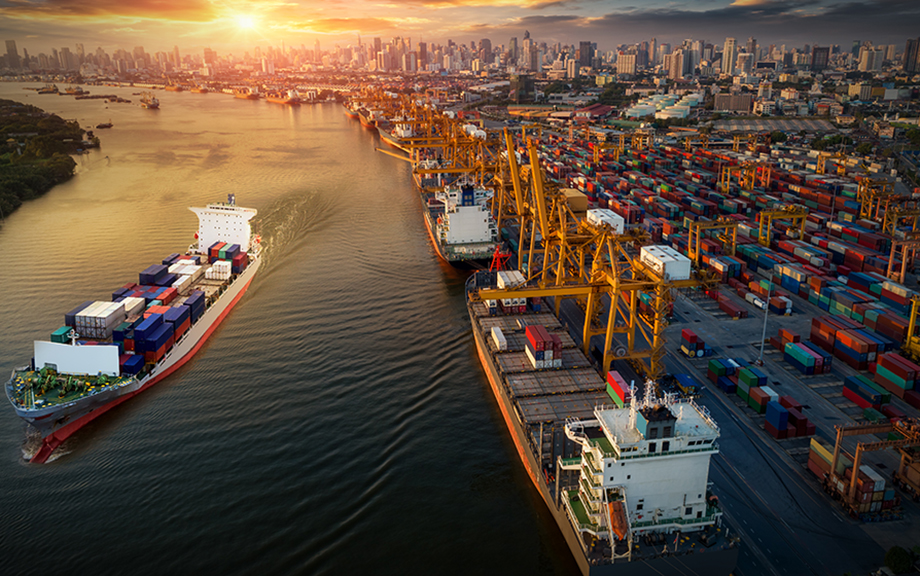
Supply chain disruptions have become a major challenge for the global economy since the start of the COVID-19 pandemic. Factory shutdowns (particularly in Asia) and widespread lockdowns and mobility restrictions have resulted in disruptions across logistics networks, increases in shipping costs, and longer delivery times. Several measures have been used to gauge these disruptions, although those measures tend to focus on selected dimensions of global supply chains. In this post, we propose a new gauge, the Global Supply Chain Pressure Index (GSCPI), which integrates a number of commonly used metrics with an aim to provide a more comprehensive summary of potential disruptions affecting global supply chains.
Posted at 7:00 am in Inflation, International Economics, Macroeconomics, Pandemic, Supply Chain | Permalink | Comments (14)
January 3, 2022
When Will U.S. Exports Take Off?
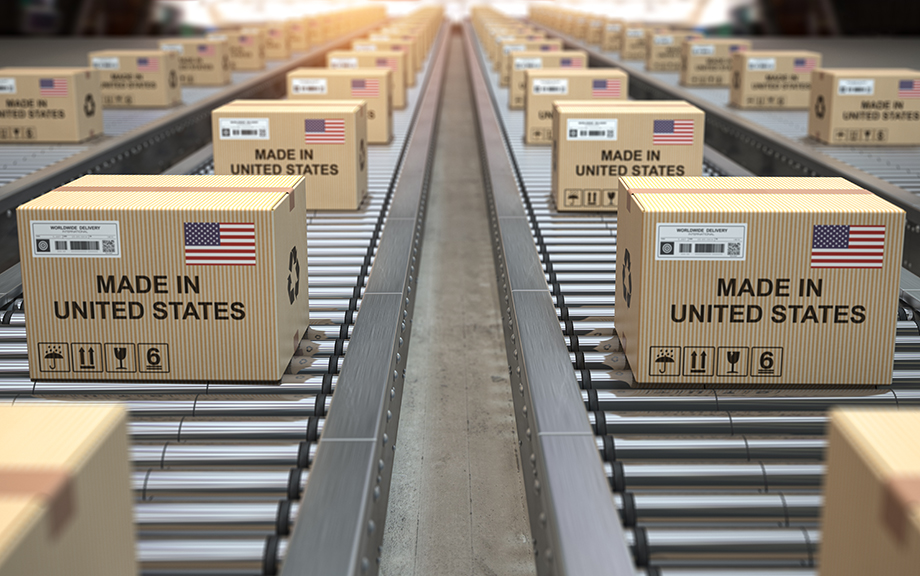
The economic recovery from the COVID-19 pandemic has been uneven across countries and sectors. While U.S. imports have rebounded to surpass their level before the collapse in 2020, U.S. exports remain far below their pre-pandemic level. This asymmetry in part reflects the different sectoral compositions of imports and exports. U.S. imports are driven by goods trade, while exports rely more heavily on services trade. A key component of services exports is foreign travel to the United States, which has dried up due to the suspension of nonessential travel imposed in March 2020. However, U.S. exports may now be at a turning point given the reopening of U.S. borders to all vaccinated travelers on November 8. We analyze the trajectory of U.S. services and how the lifting of the travel ban might contribute to the rebound of U.S. services exports.
Posted at 7:00 am in Balance of Payments, Exports, International Economics, Macroeconomics, Pandemic | Permalink
December 22, 2021
Stimulus, Savings, and Inflation: The Top Five Liberty Street Economics Posts of 2021
New York Fed researchers tackled a wide array of topics on Liberty Street Economics (LSE) over the past year, with the myriad effects of the pandemic—on supply chains, the banking system, and inequality, for example—remaining a major area of focus. Judging by the list below, LSE readers were particularly interested in understanding what comes next: the most-viewed posts of the year analyze households’ use of stimulus payments, the implications of lockdown-period savings, the risk of a new housing bubble, the compression of the breakeven inflation curve, and the potential roles that central banks could play in the digital currency sphere. As the year draws to a close, take a look back at the top five posts of 2021.
December 20, 2021
Do the Fed’s International Dollar Liquidity Facilities Affect Offshore Dollar Funding Markets and Credit?
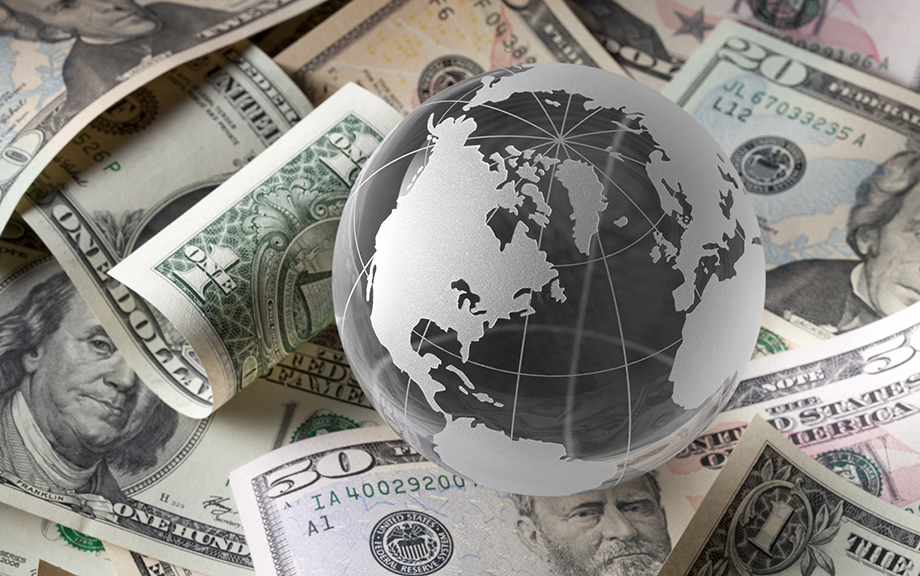
At the outbreak of the pandemic, in March 2020, the Federal Reserve implemented a suite of facilities, including two associated with international dollar liquidity—the central bank swap lines and the Foreign International Monetary Authorities (FIMA) repo facility—to provide dollar liquidity. This post discusses recent evidence showing the contributions of these facilities to financial and economic stability, highlighting evidence from recent research by Goldberg and Ravazzolo (December 2021).
Posted at 9:00 am in Financial Institutions, Financial Markets, International Economics, Liquidity, Pandemic | Permalink
December 17, 2021
The Region Is Struggling to Recover from the Pandemic Recession

The pandemic struck the New York-Northern New Jersey region early and hard, and the economy is still struggling to recover nearly two years later. Indeed, employment fell by 20 percent in New York City as the pandemic took hold, a significantly sharper decline than for the nation as a whole, and the rest of the region wasn’t far behind, creating a much larger hole to dig out of than other parts of the country. While the region saw significant growth as the economy began to heal, growth has slowed noticeably, and job shortfalls—that is, the amount by which employment remains below pre-pandemic levels—are some of the largest in the nation. Among major metro areas, job shortfalls in New York City, Buffalo, and Syracuse rank among the five worst in the country. Thus, despite much progress, the region is struggling to recover from the pandemic recession. By contrast, employment has rebounded above pre-pandemic levels in Puerto Rico, reaching a five-year high.
Posted at 11:00 am in Labor Market, New Jersey, New York, Pandemic, Recession, Unemployment | Permalink
November 22, 2021
Preemptive Runs and the Offshore U.S. Dollar Money Market Funds Industry

In March 2020, U.S. dollar-denominated prime money market funds (MMFs) suffered heavy outflows as concerns about the COVID-19 pandemic increased in the United States and Europe. Investors redeemed their shares en masse not only from funds domiciled in the United States (“domestic”) but also from offshore funds. In this post, we use differences in the regulatory regimes of domestic and offshore funds to identify the impact of the redemption gates and liquidity fees recently introduced as part of MMF industry reforms in both the United States and Europe.
November 15, 2021
Banking System Vulnerability through the COVID‑19 Pandemic

More than a year into the COVID-19 pandemic, the U.S. banking system has remained stable and seems to have weathered the crisis well, in part because of effects of the policy actions undertaken during the early stages of the pandemic. In this post, we provide an update of four analytical models that aim to capture different aspects of banking system vulnerability and discuss their perspective on the COVID pandemic. The four models, introduced in a Liberty Street Economics post in November 2018 and updated annually since then, monitor vulnerabilities of U.S. banking firms and the way in which these vulnerabilities interact to amplify negative shocks.
November 9, 2021
Credit Card Trends Begin to Normalize after Pandemic Paydown

Today, the New York Fed’s Center for Microeconomic Data released its Quarterly Report on Household Debt and Credit for the third quarter of 2021. Overall debt balances increased, bolstered primarily by a sizeable increase in mortgage balances, and for the second consecutive quarter, an increase in credit card balances. The changes in credit card balances in the second and third quarters of 2021 are remarkable since they appear to be a return to the normal seasonal patterns in balances. In a Liberty Street Economics post earlier this year we wrote about some demographic variation in these balance changes and the likely role of stimulus checks and forbearance programs in helping borrowers pay down expensive revolving debt balances. Here, we’ll take a fresh look at credit card balances and at the dynamics behind new and closing credit card accounts and limit changes, to examine how credit access and usage continue to evolve. The Quarterly Report and this analysis are based on our Consumer Credit Panel, which is itself based on Equifax credit data.
October 22, 2021
How Much Have Consumers Spent on Imports during the Pandemic?

The return of U.S. real GDP to its pre-pandemic level in the second quarter of this year was driven by consumer spending on goods. Such spending was well above its pre-pandemic path, while spending on services was well below. Despite the surge in goods spending, domestic manufacturing has increased only modestly, leaving most of the increase in demand being filled by imports. While higher imports have been a drag on growth, the size of this drag has been moderated by the value created by the domestic transportation, wholesale, and retail sectors in selling these goods. Going forward, a rebalancing of consumer spending toward services could give a lift to growth, by shifting demand toward purchases with little import content.
October 21, 2021
Severe Supply Disruptions Are Impeding Business Activity in the Region
As the economy continues to recover from the pandemic recession, many businesses are struggling to keep up with surging demand amid widespread supply shortages and delays. While a rare phenomenon before the pandemic, supply chain disruptions have become increasingly common, with transportation of goods becoming especially tricky due to myriad issues such as clogged ports and difficulty finding truck drivers. Indeed, such supply disruptions are expected to continue into next year. Our October regional business surveys asked firms to what extent, if any, they are being affected by supply problems and what measures they have taken in response. Difficulty obtaining supplies was nearly universal among survey respondents, affecting about 80 percent of service firms and 95 percent of manufacturers. A large share of businesses in the region have responded to the disruptions by increasing their selling prices and scaling back their operations.
Posted at 7:00 am in Macroeconomics, New Jersey, New York, Pandemic, Regional Analysis, Supply Chain | Permalink
 RSS Feed
 Follow Liberty Street Economics