Flood Risk Outside Flood Zones — A Look at Mortgage Lending in Risky Areas

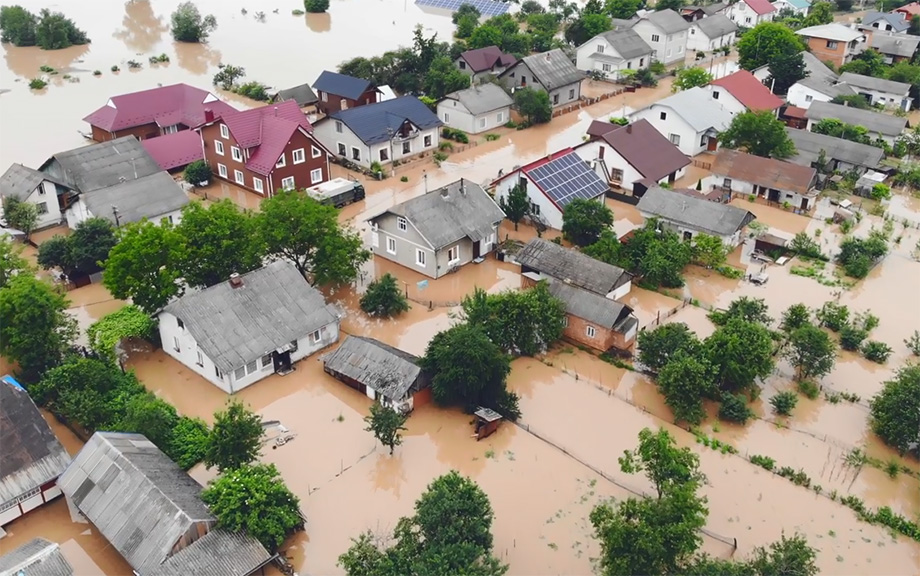
In support of the National Flood Insurance Program (NFIP), the Federal Emergency Management Agency (FEMA) creates flood maps that indicate areas with high flood risk, where mortgage applicants must buy flood insurance. The effects of flood insurance mandates were discussed in detail in a prior blog series. In 2021 alone, more than $200 billion worth of mortgages were originated in areas covered by a flood map. However, these maps are discrete, whereas the underlying flood risk may be continuous, and they are sometimes outdated. As a result, official flood maps may not fully capture the true flood risk an area faces. In this post, we make use of unique property-level mortgage data and find that in 2021, mortgages worth over $600 billion were originated in areas with high flood risk but no flood map. We examine what types of lenders are aware of this “unmapped” flood risk and how they adjust their lending practices. We find that—on average—lenders are more reluctant to lend in these unmapped yet risky regions. Those that do, such as nonbanks, are more aggressive at securitizing and selling off risky loans.
Flood Risk and Firm Location Decisions in the Fed’s Second District

The intensity, duration, and frequency of flooding have increased over the past few decades. According to the Federal Emergency Management Agency (FEMA), 99 percent of U.S. counties have been impacted by a flooding event since 1999. As the frequency of flood events continues to increase, the number of people, buildings, and agriculture exposed to flood risk is only likely to grow. As a previous post points out, measuring the geographical accuracy of such risk is important and may impact bank lending. In this post, we focus on the distribution of flood risk within the Federal Reserve’s Second District and examine its effect on establishment location decisions over the last two decades.
Potential Flood Map Inaccuracies in the Fed’s Second District

The National Flood Insurance Program (NFIP) flood maps, which designate areas at risk of flooding, are updated periodically through the Federal Emergency Management Agency (FEMA) and community efforts. Even so, many maps are several years old. As the previous two posts in the Extreme Weather series show, climate-related risks vary geographically. It is therefore important to produce accurate maps of such risks, like flooding. In this post we use detailed data on the flood risk faced by individual dwellings as well as digitized FEMA flood maps to tease out the degree to which flood maps in the Second District are inaccurate. Since inaccurate maps may leave households or banks exposed to the risk of uninsured flood damage, understanding map inaccuracies is key. We show that, when aggregated to the census tract level, a large number of maps do not fully capture flood risk. However, we are also able to show that updates do in fact improve map quality.
Insurance Companies and the Growth of Corporate Loan Securitization
Collateralized loan obligation (CLO) issuances in the United States increased by a factor of thirteen between 2009 and 2019, with the volume of outstanding CLOs more than doubling to approach $647 billion by the end of that period. While researchers and policy makers have been investigating the impact of this growth on the cost and riskiness of corporate loans and the potential implications for financial stability, less attention has been paid to the drivers of this phenomenon. In this post, which is based on our recent paper, we shed light on the role that insurance companies have played in the growth of corporate loans’ securitization and identify the key factors behind that role.


 RSS Feed
 Follow Liberty Street Economics