


3 posts on "supply chain disruption"
June 24, 2024
Deciphering the Disinflation Process

U.S. inflation surged in the early post-COVID period, driven by several economic shocks such as supply chain disruptions and labor supply constraints. Following its peak at 6.6 percent in September 2022, core consumer price index (CPI) inflation has come down rapidly over the last two years, falling to 3.6 percent recently. What explains the rapid shifts in U.S. inflation dynamics? In a recent paper, we show that the interaction between supply chain pressures and labor market tightness amplified the inflation surge in 2021. In this post, we argue that these same forces that drove the nonlinear rise in inflation have worked in reverse since late 2022, accelerating the disinflationary process. The current episode contrasts with periods where the economy was hit by shocks to either imported inputs or to labor alone.
May 20, 2024
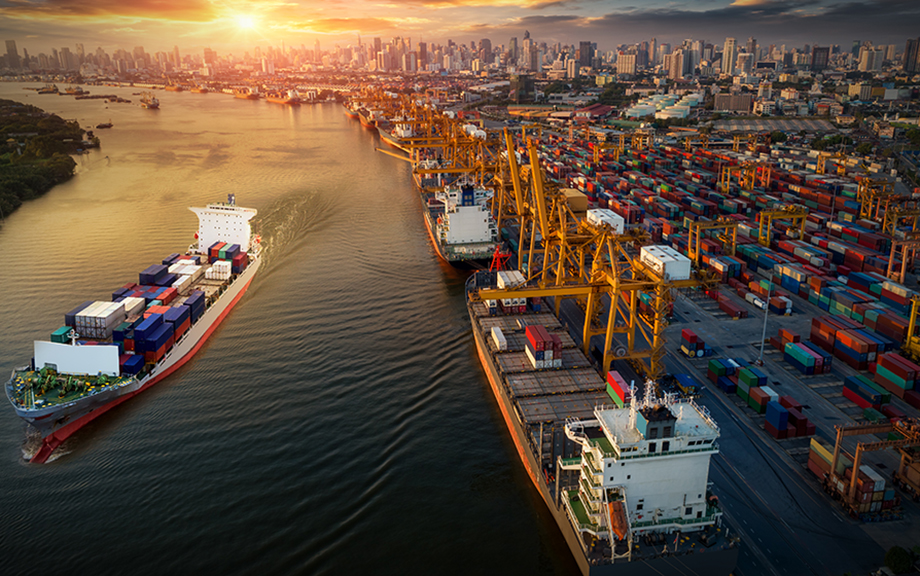
Supply Chain Disruptions Have Eased, But Remain a Concern

Supply chain disruptions became a major headache for businesses in the aftermath of the pandemic. Indeed, in October 2021, nearly all firms in our regional business surveys reported at least some difficulty obtaining the supplies they needed. These supply chain disruptions were a key contributor to the surge in inflation that occurred as the economy recovered from the pandemic recession. In this post, we present new measures of supply availability from our Business Leaders Survey and Empire State Manufacturing Survey that closely track the New York Fed’s Global Supply Chain Pressure Index (GSCPI). We will begin publishing these data on a monthly basis starting in June. These indexes indicate that supply availability had generally been improving since early 2023, but over the past couple of months, improvement has stalled. This trend is concerning since our May Supplemental Survey indicates that between a third and a half of businesses in the region are experiencing difficulties obtaining supplies, and many are reducing operations and raising prices to compensate, though to a lesser extent than a few years ago.
May 18, 2022
Global Supply Chain Pressure Index: May 2022 Update
Supply chain disruptions continue to be a major challenge as the world economy recovers from the COVID-19 pandemic. Furthermore, recent developments related to geopolitics and the pandemic (particularly in China) could put further strains on global supply chains. In a January post, we first presented the Global Supply Chain Pressure Index (GSCPI), a parsimonious global measure designed to capture supply chain disruptions using a range of indicators. We revisited our index in March, and today we are launching the GSCPI as a standalone product, with new readings to be published each month. In this post, we review GSCPI readings through April 2022 and briefly discuss the drivers of recent moves in the index.
Posted at 10:00 am in Inflation, International Economics, Macroeconomics, Pandemic, Supply Chain | Permalink | Comments (1)
 RSS Feed
 Follow Liberty Street Economics