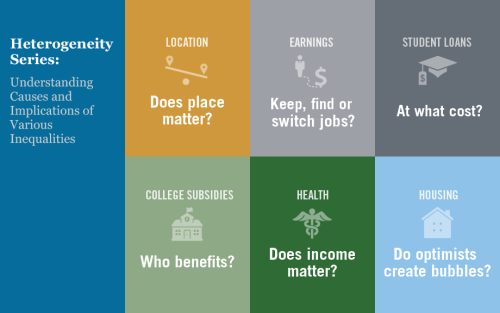
Economic analysis is often geared toward understanding the average effects of a given policy or program. Likewise, economic policies frequently target the average person or firm. While averages are undoubtedly useful reference points for researchers and policymakers, they don’t tell the whole story: it is vital to understand how the effects of economic trends and government policies vary across geographic, demographic, and socioeconomic boundaries. It is also important to assess the underlying causes of the various inequalities we observe around us, whether they are related to income, health, or any other set of indicators. Starting today, we are running a series of six blog posts (apart from this introductory post), each of which focuses on an interesting case of heterogeneity in the United States.
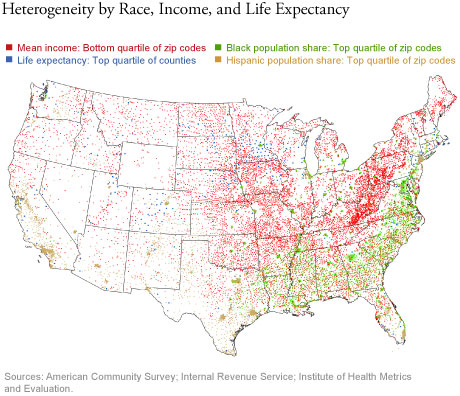
The map below shows geographic patterns of race, income, and life expectancy in the contiguous United States. Despite clear concentrations, there are visually stark differences across locations by race, income, and health. These patterns don’t only reflect geographic variations, of course; the data may very well reflect differences in outcomes and policy effects by race, income, and neighborhood.

This series of blog posts seeks to document these types of inequalities and analyze their underlying causes. Here is a brief look at each post in the series:
1. “Some Places Are Much More Unequal than Others” (October 7)

Jaison Abel and Richard Dietz look at the extent and causes of regional wage inequality. The post includes a map that reveals considerable regional wage inequalities and shows that large urban areas are among the most unequal areas in the country. The authors identify technological change, increased globalization, and agglomeration economies as important underlying causes. While a relatively low level of regional wage inequality is often the result of a weakening local economy, a relatively high level of regional wage inequality is often a result of strong but uneven economic growth.
2. “Job Ladders and Careers” (October 8)

Fatih Karahan, Brendan Moore, and Serdar Ozkan find large inequalities in lifetime earnings growth: workers in the top 1 percent of the lifetime earnings growth distribution enjoy a 27-fold increase in their earnings between ages 25-35, while those in the bottom quartile actually face a decline. The authors then seek to identify the drivers of this staggering heterogeneity and the secret to labor market success.
3. “Who Borrows for College—and Who Repays?” (October 9)

Analyzing student debt trends from the past fifteen years—massive growth in the scale and prevalence of loan balances, as well as slow repayment rates—Andrew Haughwout, Donghoon Lee, Joelle Scally, and Wilbert van der Klaauw investigate heterogeneities in borrowing and repayment behaviors with respect to neighborhood income. The post finds significant differences that have important ramifications for both policy and practice today.
4. “Is Free College the Answer to Student Debt Woes? Studying the Heterogenous Impacts of Merit Aid Programs” (October 10)

Rajashri Chakrabarti, William Nober, and Wilbert van der Klaauw cast light on the “free college” debate and the efficacy of various tuition-subsidy programs. Exploiting state merit scholarship programs over almost the past twenty-five years, the post starts by investigating the effect of merit scholarship eligibility on educational enrollment on the one hand and student debt and default on the other. The authors look beyond the average effects to understand whether outcomes are different for individuals from low-income zip codes or zip codes in which a high share of the population is black or Hispanic.
5. “Does U.S. Health Inequality Reflect Income Inequality—or Something Else?” (October 15)

Maxim Pinkovskiy highlights that life expectancy among Americans is becoming increasingly correlated with income, and that inequality in life expectancy is increasing over time. The post first highlights this health inequality and then digs deeper to investigate the drivers. It asks whether this heterogeneity is due to differences in access to health care or the result of other factors, such as the incidence of various health-related behaviors (smoking, obesity, exercise).
6. “Optimists and Pessimists in the Housing Market” (October 16)

In the final post of the series, Haoyang Liu and Christopher Palmer focus on individuals’ heterogeneous beliefs about home price trends. While individuals use past home price appreciation to extrapolate future home price appreciation, there is considerable heterogeneity in this extrapolation. Understanding this heterogeneity is important since a small fraction of optimistic home buyers can potentially cause a large boom-bust cycle.
Overall, this series underscores the importance of understanding the differential impacts of policy across different groups and neighborhoods, with heterogeneity seen in almost any indicator one can think of in the United States. It is equally important to understand the underlying causes of these inequalities in economic outcomes, beliefs, and other indicators. The posts in this series address both of these challenges. Examining heterogeneous distributions of income, health outcomes, economic beliefs, and debt incidence gives us a much more thorough understanding of policy and practice than a mere investigation of average effects would ever yield. Policies based on insights from such heterogeneity analysis promise to reach disparate sections of our society more effectively than policies targeted at the average person.

Rajashri Chakrabarti is a senior economist in the Federal Reserve Bank of New York’s Research and Statistics Group.
 William Nober is a senior research analyst in the Bank’s Research and Statistics Group.
How to cite this post:
Rajashri Chakrabarti and William Nober, “Introduction to Heterogeneity Series: Understanding Causes and Implications of Various Inequalities,” Federal Reserve Bank of New York Liberty Street Economics, October 7, 2019, https://libertystreeteconomics.newyorkfed.org/2019/10/introduction-to-heterogeneity-series-understanding-causes-and-implications-of-various-inequalities.html.
Additional heterogeneity posts on Liberty Street Economics.
Heterogeneity: A Multi-Part Research Series
Disclaimer
The views expressed in this post are those of the authors and do not necessarily reflect the position of the Federal Reserve Bank of New York or the Federal Reserve System. Any errors or omissions are the responsibility of the authors.


 RSS Feed
 Follow Liberty Street Economics