


As shown in a past Liberty Street Economics post, in the United States, the yields of money market fund (MMF) shares respond to changes in monetary policy rates much more than the rates of bank deposits; in other words, the MMF beta is much higher than the deposit beta. Consistent with this, the size of the U.S. MMF industry fluctuates over the interest rate cycle, expanding during times of monetary policy tightening. In this post, we show that the relationship between the policy rates of the European Central Bank (ECB) and the size of European MMFs investing in euro-denominated securities is also positive—as long as policy rates are positive; after the ECB introduced negative policy rates in 2015, that relationship broke down, as MMFs received large inflows during this period.
European MMFs
MMFs are a type of open-end mutual fund that invest in short-term money-market instruments with low credit risk. Due to the nature of their investments, MMFs are money-like instruments that provide investors with returns close to current money-market rates. Similar to their U.S. counterparts, European MMFs can be divided into government funds (usually called “public debt funds”) and prime funds based on their portfolio holdings: government MMFs mainly invest in debt securities issued by the public sector or repurchase agreements (repos) collateralized by such securities, whereas prime MMFs can also invest in uncollateralized debt securities issued by the private sector. European MMFs are regulated under Regulation (EU) 2017/1131 of the European Parliament and of the Council of the European Union (EU), which was adopted in 2017 in response to the 2008 run experienced by MMFs.
In this post, we focus on “euro-denominated MMFs”—that is, European MMFs investing in euro-denominated securities. The size of this industry is much smaller than its U.S. equivalent: in July 2023, euro-denominated MMFs managed $0.72 trillion (€0.65 trillion) in assets; in comparison, U.S. MMFs managed $6 trillion (€5.4 trillion). The composition of the industry is also different: euro-denominated MMFs are mainly prime funds with variable net asset value (NAV), with government funds (operating with a constant NAV) representing less than 1 percent of the industry; in contrast, in the U.S., government MMFs make up 78 percent of the industry.
The Beta on European MMFs
As in the U.S. market, the beta of euro-denominated MMFs is much higher than that of EU bank deposits; in other words, MMF yields track the policy rate more closely than bank deposit rates do. The chart below shows the rates on several euro-denominated money-market instruments between 2006 and 2023: 1) the average yield on euro-denominated MMFs (blue line); 2) the interest rate on overnight bank deposits of nonfinancial companies (red line); and 3) the ECB’s deposit facility rate (DFR, gold line), which is the rate banks earn on their overnight deposits at the ECB (and the ECB’s key policy rate).
As the chart below shows, overnight EU deposit rates move slowly, with a low beta, similar to what we observe for U.S. deposits: in particular, the EU deposit rate increased by just 1 percentage point (pp) during 2006-07, whereas the ECB’s DFR was raised by 1.5 pp during the same period. During the latest tightening cycle, the difference has been even more stark: while the DFR was raised by 4 pp during 2022-23, the deposit rate increased by 0.6 pp during the same period. Moreover, whereas the DFR reached negative territory in June 2014, the deposit rate only went below zero in 2021.
MMF Yields Move Closely with the ECB Policy Rate
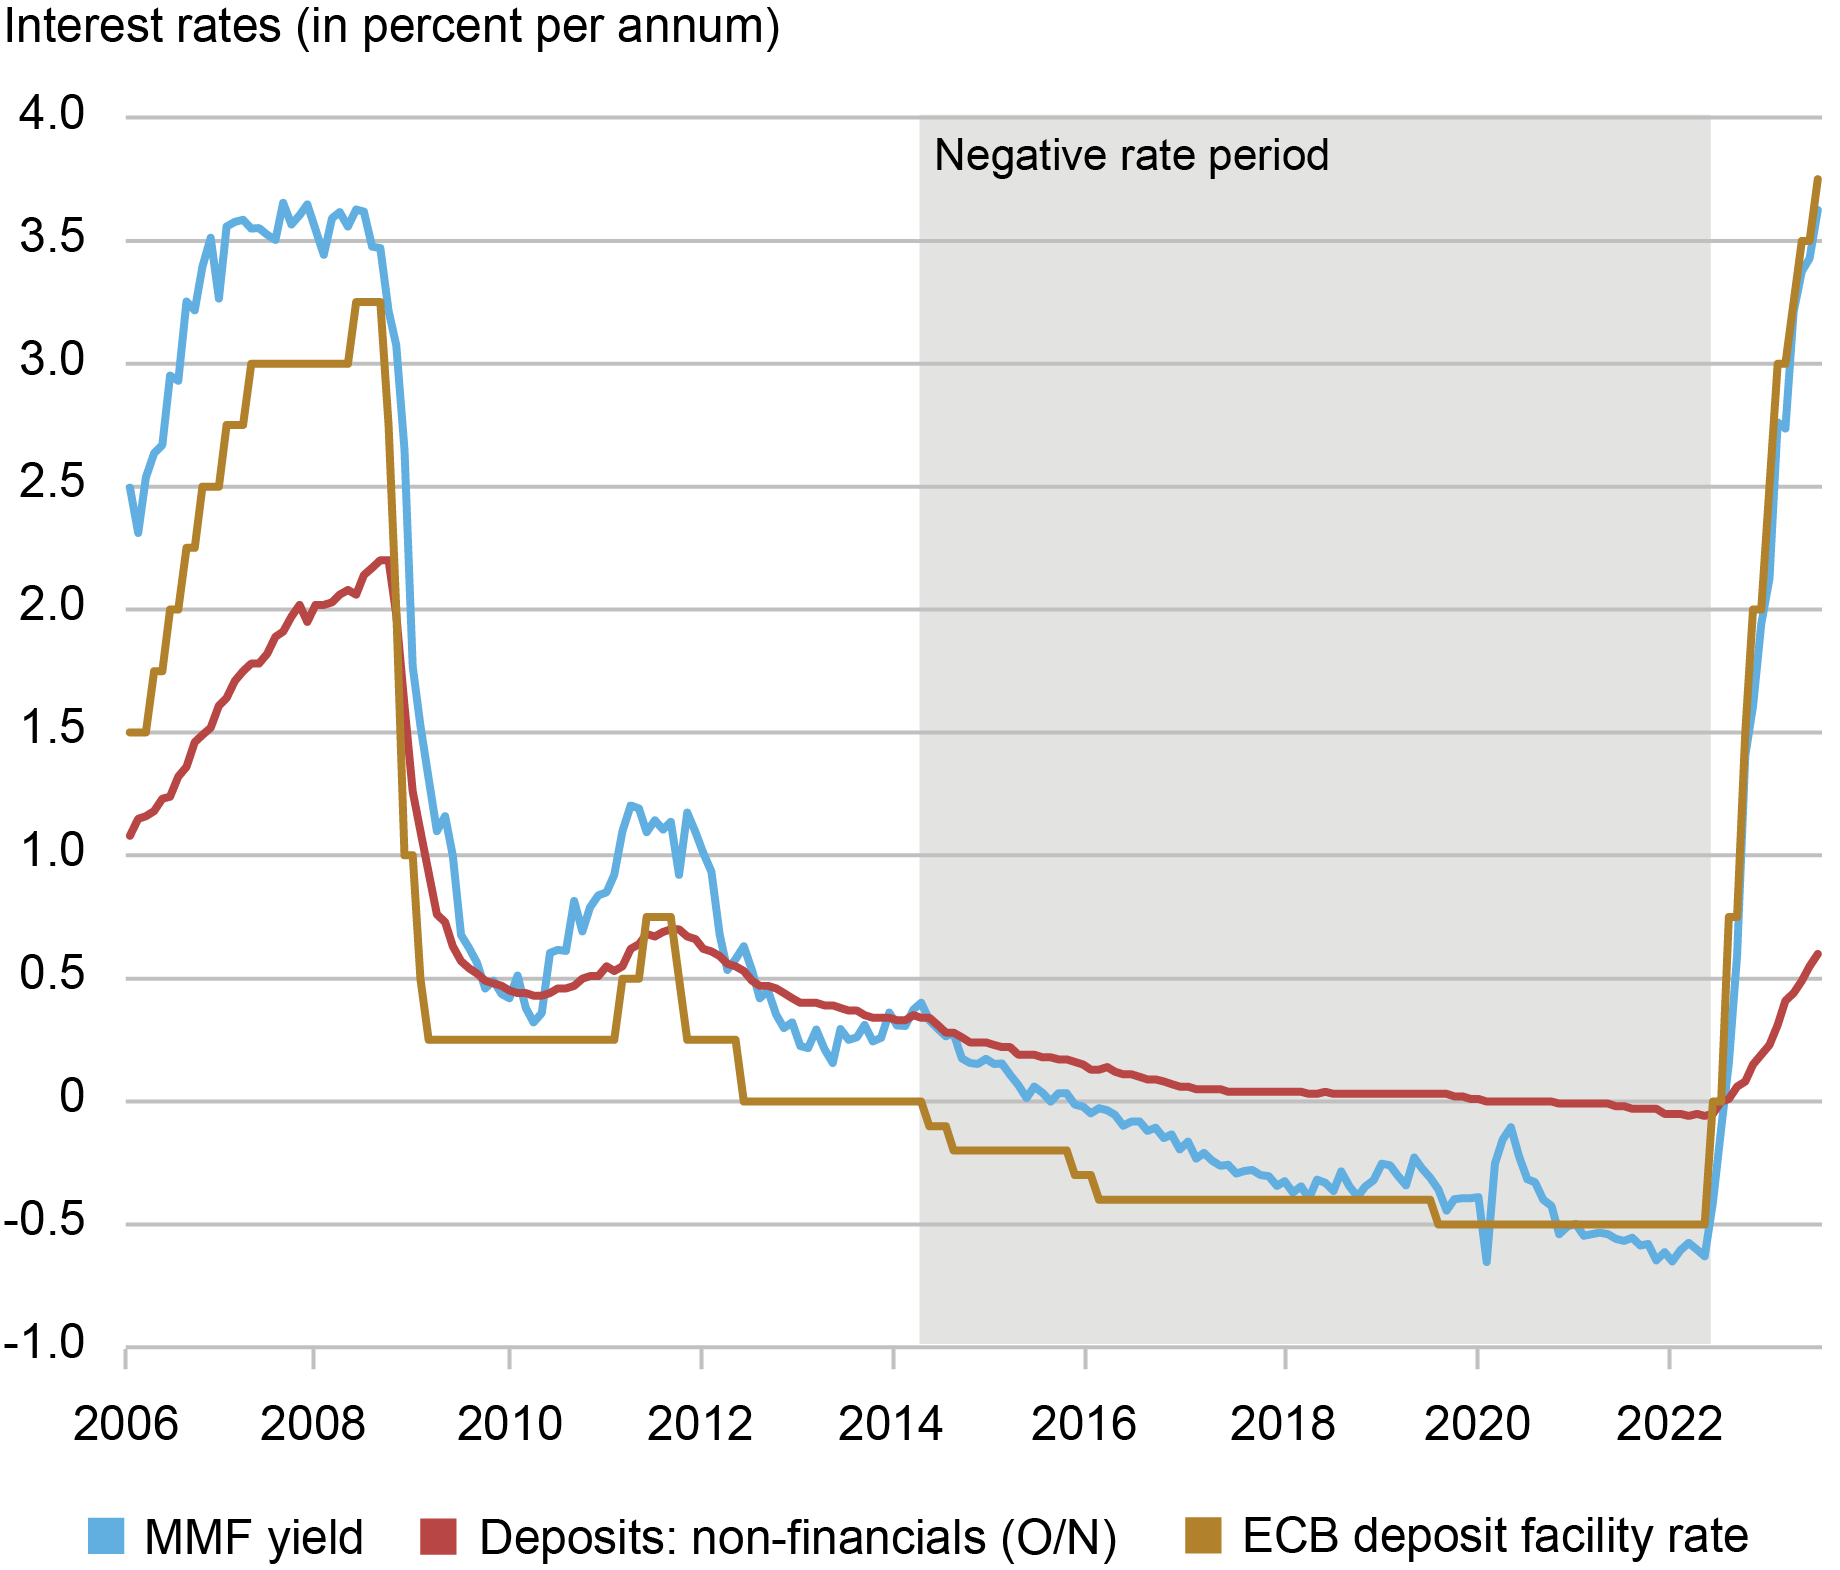
Source: ECB Data Portal and Morningstar Direct
In contrast, the average yield of euro-denominated MMFs follows the DFR much more tightly, increasing sharply during the brief hiking cycle in 2011 as well as in the latest hiking cycle initiated in 2022. Indeed, the yield on MMF shares becomes negative in December 2015, following the ECB’s adoption of a negative interest rate policy in June 2014. In other words, despite the delayed arrival of negative MMF yields, the beta on euro-denominated MMFs is much higher than that on bank deposits, similar to the U.S. experience.
Monetary Policy and the Size of the European MMF Industry
As documented in a past post, the size of the U.S. MMF industry moves together with the monetary policy cycle. When rates increase, U.S. MMFs grow in size, and then shrink when the Federal Reserve eases monetary policy. This pattern was evident during the last tightening cycle, for example: the assets managed by U.S. MMFs increased by $1 trillion between 2022:Q2 and 2023:Q3, reaching over $6 trillion. The positive relationship between the Fed’s monetary policy stance and the size of the MMF industry is consistent with investors leaving bank deposits for MMF shares because of their significantly higher beta in a rising rate environment.
A similar positive relationship existed between the ECB’s policy stance and the size of euro-denominated MMFs during the tightening-and-easing cycles of 2006-12. The relationship, however, broke down during the period of negative interest rates.
The chart below shows the total net assets managed by euro-denominated MMFs, along with the DFR. In particular, despite policy rates falling into negative territory, European MMFs received substantial inflows from 2015 onwards. This is in stark contrast to the usual positive relationship between interest rates and the size of the MMF sector. The growth in MMF assets was particularly driven by institutional-oriented MMFs, which grew by €43 billion (34 percent) between June 2014 and June 2016—compared to an increase of €27 billion (14 percent) for retail-oriented MMFs. As the ECB further cut interest rates in September 2019, MMFs continued to experience significant inflows, despite providing negative yields.
One reason for the behavior of institutional investors might have been the relative attractiveness of MMF yields compared to other wholesale money-market rates available to institutional investors. For example, the Euro Overnight Index Average (EONIA) and the Euro Short-Term Rate (€STR), which measure the cost of wholesale unsecured overnight borrowing in euros for banks located in the euro area, were even lower than the yields offered by euro-denominated MMFs during the period of negative rates. In other words, in contrast to retail deposit rates, rates offered to institutional investors continue to closely follow the policy rate once it turns negative, and MMF yields can remain attractive relative to them
Euro-Denominated MMF Industry Grew even as ECB Policy Rate Became Negative
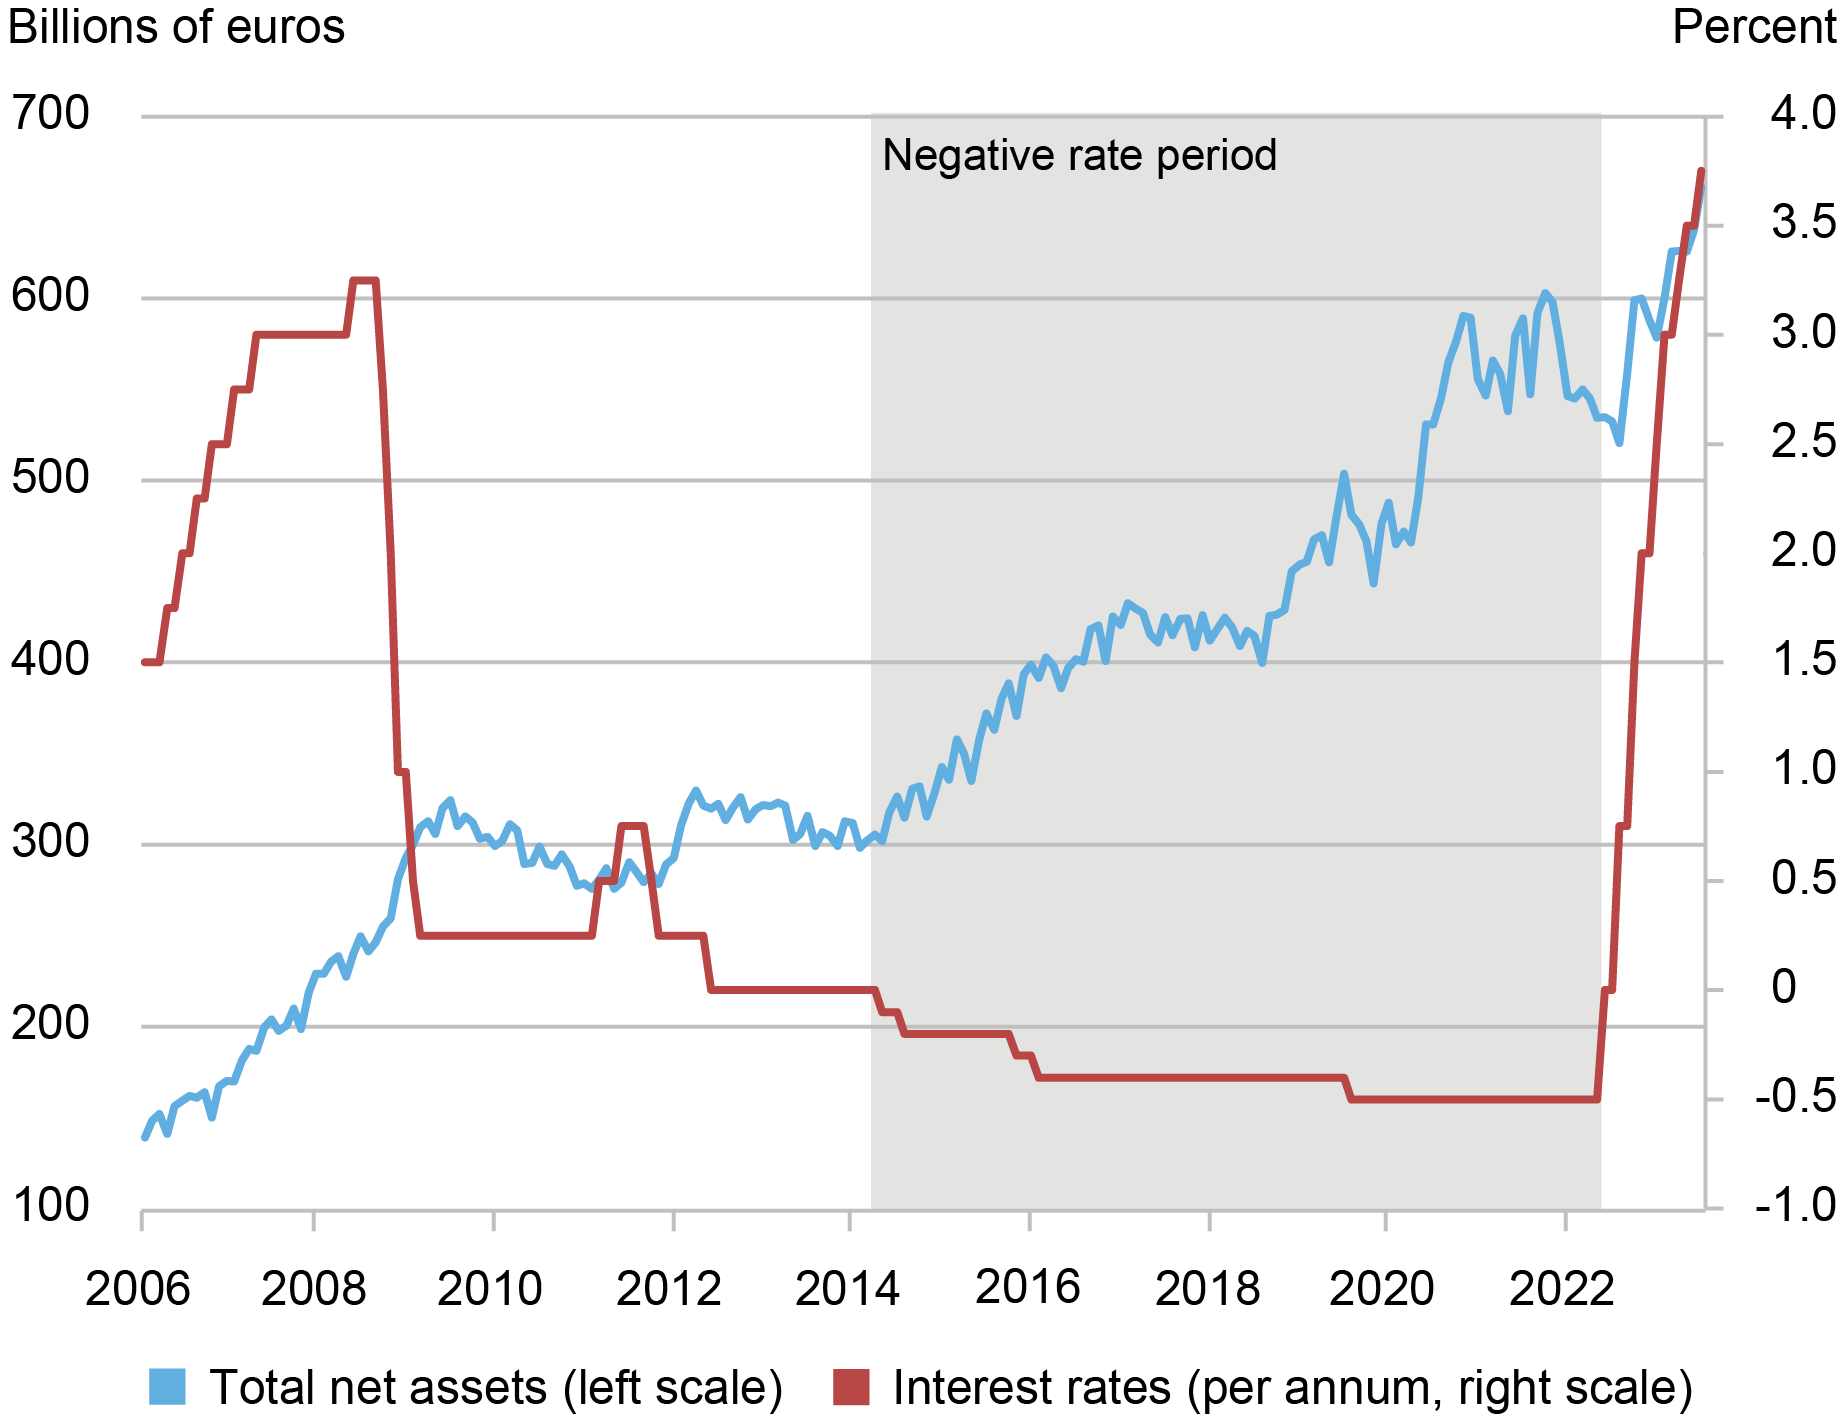
Source: ECB Data Portal and MorningstarDirect
The size of the euro-denominated MMF industry stabilized in 2021, hovering around €570 billion. The usual positive relationship between policy rates and MMF flows re-emerged after the onset of the ECB’s latest hiking cycle in July 2022. Between June 2022 and August 2023, euro denominated MMFs grew by more than €100 billion, reflecting both the higher policy rate and the particular attractiveness of short-term investment vehicles in an inverted yield curve environment.
Summing Up
This post documents that, similar to the general pattern in the United States, the yields on European MMF shares display a much tighter relationship with monetary policy compared to bank deposit rates. In line with the observations in the U.S. market, such a high beta on MMF shares implies that the size of the European MMF industry usually increases when policy rates increase. During the introduction of negative policy rates, however, this positive relationship broke down: negative rates were associated with inflows into euro-denominated MMFs, as MMF yields remained competitive with respect to other short-term investment vehicles offered to institutional investors. During the ECB’s recent tightening cycle, the positive relationship between the ECB’s monetary policy stance and the size of the euro-denominated MMF sector re-emerged.

Marco Cipriani is the head of Money and Payments Studies in the Federal Reserve Bank of New York’s Research and Statistics Group.

Daniel Fricke is a research economist at the Deutsche Bundesbank.

Stefan Greppmair is a research economist at the Deutsche Bundesbank.

Gabriele La Spada is a financial research advisor in Money and Payments Studies in the Federal Reserve Bank of New York’s Research and Statistics Group.

Karol Paludkiewicz is a senior research economist and deputy head of the Financial Markets Research Section at the Deutsche Bundesbank.
How to cite this post:
Marco Cipriani, Daniel Fricke, Stefan Greppmair, Gabriele La Spada, and Karol Paludkiewicz, “Monetary Policy and Money Market Funds in Europe,” Federal Reserve Bank of New York Liberty Street Economics, April 11, 2024, https://libertystreeteconomics.newyorkfed.org/2024/04/monetary-policy-and-money-market-funds-in-europe/.


Disclaimer
The views expressed in this post are those of the author(s) and do not necessarily reflect the position of the Federal Reserve Bank of New York, the Federal Reserve System, the Deutsche Bundesbank, or the Eurosystem. Any errors or omissions are the responsibility of the author(s).
 RSS Feed
 Follow Liberty Street Economics