


Nonbank financial institutions (NBFIs) are growing, but banks support that growth via funding and liquidity insurance. The transformation of activities and risks from banks to a bank-NBFI nexus may have benefits in normal states of the world, as it may result in overall growth in (especially, credit) markets and widen access to a wide range of financial services, but the system may be disproportionately exposed to financial and economic instability when aggregate tail risk materializes. In this post, we consider the systemic implications of the observed build-up of bank-NBFI connections associated with the growth of NBFIs.
Is the Bank-NBFI Interdependence a Systemic Risk?
Based on our recent paper, we show that the growth of NBFIs not only accompanies but indeed facilitates the growth in asset- and liability-dependencies between banks and NBFIs. In other words, the asset portfolio values and sources of funding of each sector depend on the other. When markets operate normally, the transformation of activities and risks in the bank-NBFI nexus may be considered a net positive for the system, since risks appear to migrate to the nonbanks that can seemingly absorb those risks without threatening payments and settlements mechanisms, thereby reducing the need for market-wide interventions by authorities in times of stress. As former Federal Reserve chairman Paul Volcker once put it in an interview about financial innovation: “…There is nothing wrong with [nonbank] activities, … [they] provide fluidity in markets and flexibility [but] [i]f you fail, you’re going to fail and I am not going to help you ….”
In reality, however, we have observed how in times of heightened market-wide stress, such as the global financial crisis (GFC) of 2007-08 and the COVID outbreak of March 2020, the demands for liquidity from NBFIs queue up at banks and then at the official sector. Effectively, bank-NBFI dependencies turn into vectors of shock transmission and amplification, forcing authorities to intervene and to do so en masse.
Why Is the Bank-NBFI Interdependence a Systemic Risk?
As NBFIs have increasingly been playing intermediation roles similar to those of banks, and adopting similar business models, their asset composition is naturally also becoming similar to those of banks. In a post last year, based on another research paper, we highlighted how the commonality of asset holdings between banks and NBFIs could turn out to be an important source of market disruption, driven by asset-pricing dislocations in the event of forced asset sales by NBFIs in need of liquidity. Because of the increasing similarity in the asset profile of the various NBFI sectors and banks, the extent of these market disruptions could be rather severe.
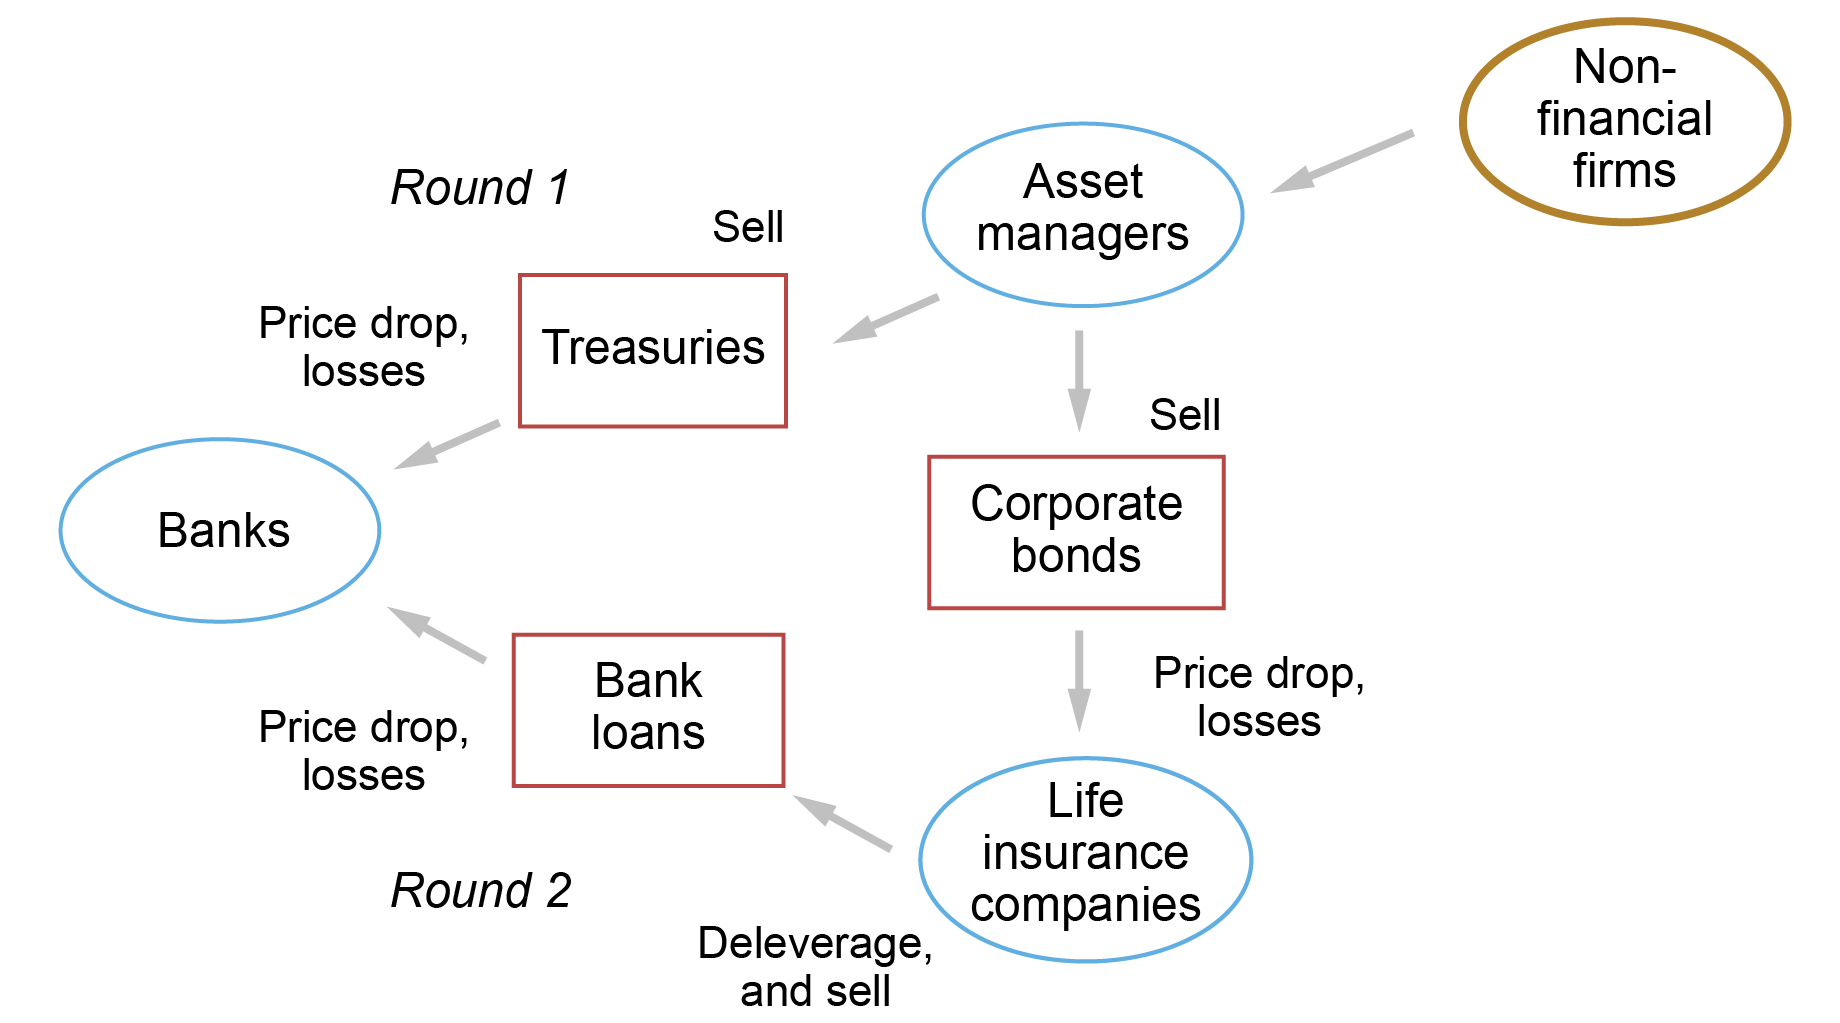
Consider the hypothetical scenario of risk spillovers illustrated in the figure below. Imagine a shock to the real economy that reduces the value of claims on nonfinancial firms depicted in the upper-right corner of the figure. This shock, by distressing the portfolio of, say, asset managers (for example, mutual funds, ETFs, or hedge funds) holding those claims, could trigger forced sales of any or all of the assets held by those asset managers. In this stylized example, asset managers may respond by selling Treasuries and corporate bonds. Banks—who in this illustrative example are assumed to hold Treasuries and loans, but not corporate bonds—initially (in Round 1) suffer losses due to the depressed, fire-sale prices of Treasuries. However, the asset manager’s fire sales of corporate bonds may stress the portfolios of other NBFIs (life insurance companies in the chart) also holding corporate bonds. In turn, the latter may sell not only corporate bonds but also bank loans, thus inflicting additional (in Round 2) losses on bank portfolios. Hence, banks may be highly vulnerable to NBFI distress as a result of these network externalities.
Asset-Commonality Amplification: NBFIs to Banks
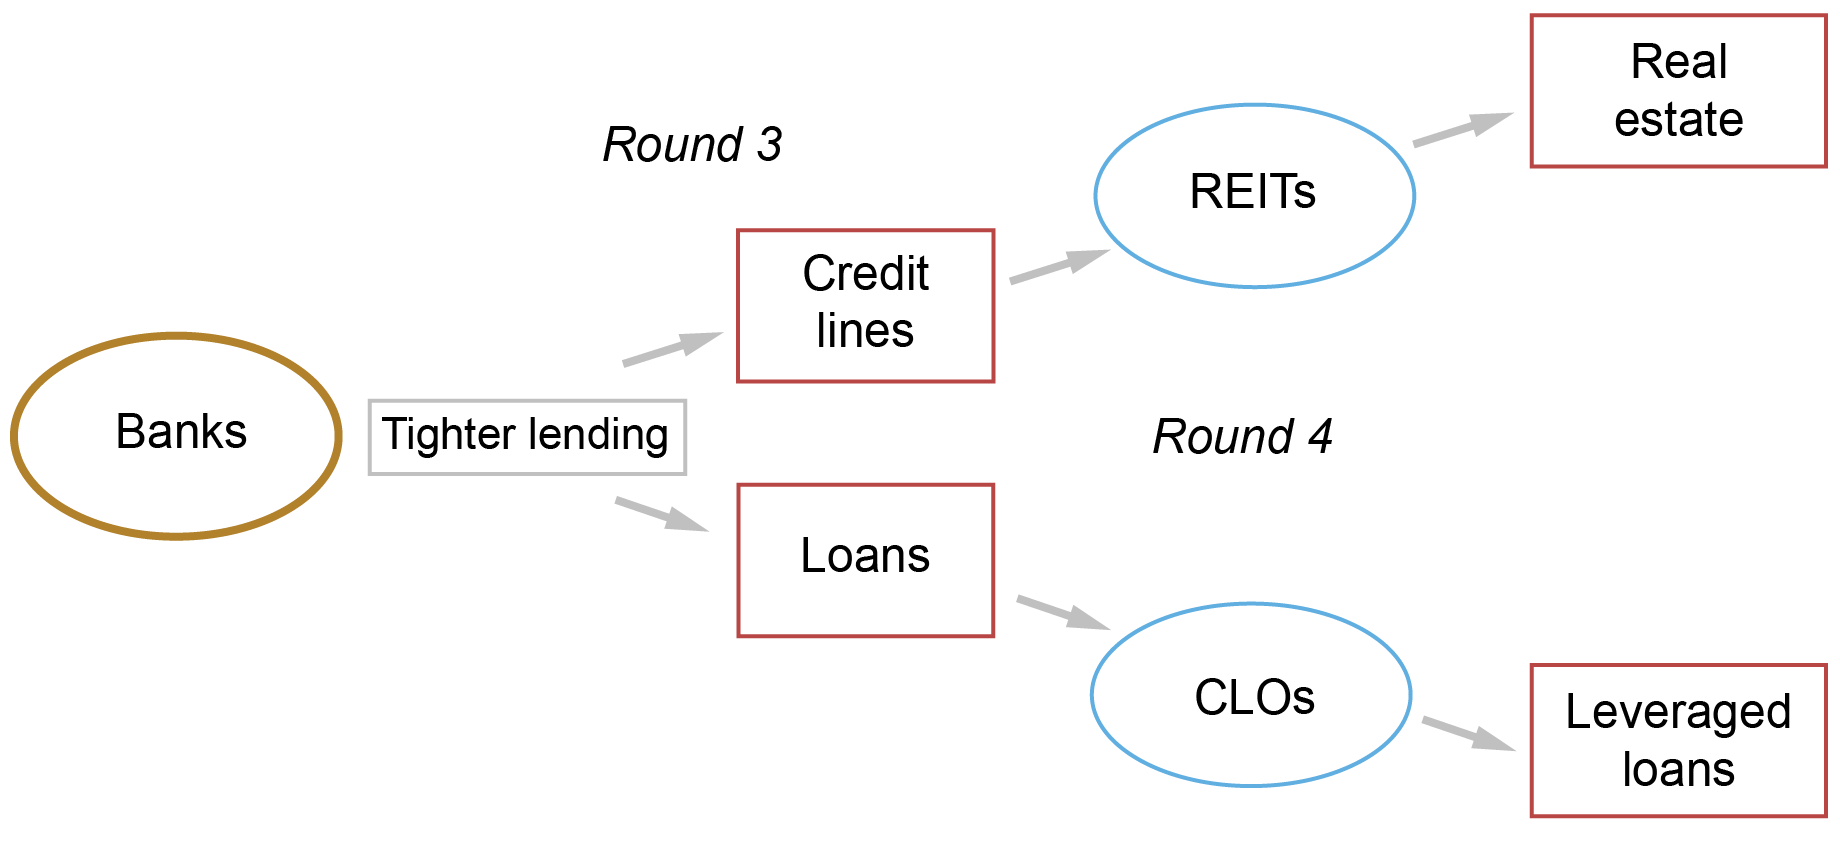
Even more important, the entire system of financial intermediation is potentially more fragile because of the interconnections. To see why this is the case, consider the potential for systemic fragility when we also take into account the liability interdependencies between banks and NBFIs. Banks experiencing distress because of the asset losses driven by NBFIs’ sales, may, in turn, reduce funding/liquidity support to NBFIs causing risks to spill back to NBFIs and the real economy. The figure below illustrates how this may play out. Banks may, say, reduce credit lines to real estate investment trusts (REITs) and also reduce holdings of term loans to collateralized loan obligations (CLOs). As a result of these Round 3 and Round 4 transmissions, REITs might reduce their investments in residential and commercial real estate and CLOs might reduce their investments in leveraged loans, thus propagating and amplifying the original shock to nonfinancial firms with increasingly complex economic ramifications.
Liability-linked Amplification: Banks to NBFIs
The systemic consequences may be even more pernicious than depicted in the example above since we have assumed that NBFIs would operate initially with the same risk profile as when these risks were on bank balance sheets. However, since NBFIs operate under a less restrictive regulatory regime and monitoring standards, they may have incentives to originate even more risk than banks, which in turn may imply a higher likelihood of stress events and/or potentially even more severe amplification of systemic risks.
Quantifying the Systemic Footprint of NBFIs
We ask if the systemic footprint of banks and NBFIs is becoming more correlated over time. To this end, we measure the correlation of the systemic risks of the two sectors and, secondly, we test whether abnormal equity returns of the two sectors Granger-cause each other.
To study the correlation of systemic risks, we use SRISK, a measure of market-equity-based capital shortfall of a financial firm under aggregate market stress. This well-known metric captures the percentage of financial sector capital shortfall that would be experienced by this firm—or in our case a specific sector—in the event of a crisis. We use time-series data for both individual banks and NBFI firms, then aggregate the SRISK measure for the two sectors, and finally compute the twenty-day rolling correlation of percentage changes in the two resulting indexes.
The results, in the bar chart below, show that the correlation of bank and NBFI sector-wide SRISK has risen steadily from about 65 percent in the pre-GFC period to upwards of 80 percent post GFC, with peaks in the period since the pandemic. This increase in correlation seems at odds with the widely held favorable perception of post-GFC reforms that were designed to strengthen the banking system and protect it from the failures of NBFIs, but seems entirely consistent with the transformation view of activities and risks across the bank-NBFI nexus that we document in our paper.
Correlation of Bank and NBFI Sector-Wide Risk Has Risen Since the Global Financial Crisis
| Period | |
| 1-Jan-00 to 31-Jul-07 | Pre-GFC |
| 1-Aug-07 to 31-Oct-09 | GFC |
| 1-Nov-09 to 30-Nov-14 | Post-GFC |
| 1-Dec-14 to 30-Jun-16 | Oil price shock |
| 1-Jul-16 to 31-Dec-19 | Rate hike + QT |
| 1-Jan-20 to 31-Oct-21 | Pandemic |
| 1-Nov-21 to 31-Dec-22 | Post-pandemic |
| 1-Jan-23 to 1-May-23 | SVB stress |
Correlation
Notes: This chart reports the twenty-day rolling correlation of percentage changes in sector-wide bank and NBFI SRISK in a range of time periods. QT is quantitative tightening. SVB is Silicon Valley Bank.
These correlations may simply reflect the common market exposures of banks and NBFIs. To demonstrate a direction to the bank-NBFI interdependence consistent with our transformation view, we conducted Granger-causality tests of abnormal, equally weighted daily equity-return indexes of NBFIs and banks. To construct abnormal returns, we adjusted each daily index return for that day’s S&P 500 return based on its ninety-day rolling historical beta. Then, starting on the ninety-first day of each subperiod, as defined above, and until the last day of the subperiod, we conducted daily Granger causality tests for the abnormal NBFI and bank equity-return indexes over the ninety-day historical window. The fraction of days in each subperiod for which the p-value of the Granger-causality test is less than 10 percent is reported in the table below, with the left column for banks causing NBFIs and the right column for NBFIs causing banks.
Granger-Causality Tests of Bank and NBFI Abnormal Returns
| Fraction of days with p-value < 10% when | |||
|---|---|---|---|
| Period | Banks cause NBFIs | NBFIs cause Banks | |
| 1-Jan-00 to 31-Jul-07 | Pre-GFC | 13% | 5% |
| 1-Aug-07 to 31-Oct-09 | GFC | 33% | 25% |
| 1-Nov-09 to 30-Nov-14 | Post-GFC | 18% | 18% |
| 1-Dec-14 to 30-Jun-16 | Oil shock | 9% | 0% |
| 1-Jul-16 to 31-Dec-19 | Hike + QT | 13% | 15% |
| 1-Jan-20 to 31-Oct-21 | Pandemic | 36% | 31% |
| 1-Nov-21 to 31-Dec-22 | Post-pandemic | 26% | 67% |
| 1-Jan-23 to 1-May-23 | SVB stress | 24% | 62% |
Notes: QT is quantitative tightening. SVB is Silicon Valley Bank.
Three observations are striking. One, consistent with the SRISK correlation in the previous bar chart, bank and NBFI sectors’ abnormal equity returns Granger-cause each other more robustly during and after the GFC than before the GFC. Two, NBFIs Granger-cause bank returns more frequently in the post-pandemic and Silicon Valley Bank stress periods. Three, the GFC and pandemic periods are particularly characterized by banks and NBFIs Granger-causing each other. NBFIs likely caused adverse bank returns in the GFC period through banks’ poorly performing (NBFI) off-balance sheet vehicles and in the pandemic periods through drawdowns of bank credit lines. Banks likely caused adverse NBFI returns during those periods through reduced provision of liquidity and liquidity insurance to NBFIs.
Summing Up
We showed evidence of the propagation of systemic risk between banks and NBFIs via their increased interdependence. Our results underscore the key theme of our research paper, namely that effective financial regulation and systemic risk surveillance requires a holistic approach that recognizes banks and NBFIs as highly interdependent sectors.
Viral V. Acharya is a professor of finance at New York University Stern School of Business.

Nicola Cetorelli is the head of Non-Bank Financial Institution Studies in the Federal Reserve Bank of New York’s Research and Statistics Group.
Bruce Tuckman is a professor of finance at New York University Stern School of Business.
How to cite this post:
Viral V. Acharya, Nicola Cetorelli, and Bruce Tuckman, “The Growing Risk of Spillovers and Spillbacks in the Bank‑NBFI Nexus,” Federal Reserve Bank of New York Liberty Street Economics, June 20, 2024, https://libertystreeteconomics.newyorkfed.org/2024/06/the-growing-risk-of-spillovers-and-spillbacks-in-the-bank-nbfi-nexus/.


Disclaimer
The views expressed in this post are those of the author(s) and do not necessarily reflect the position of the Federal Reserve Bank of New York or the Federal Reserve System. Any errors or omissions are the responsibility of the author(s).
 RSS Feed
 Follow Liberty Street Economics