Editor’s Note: When this post was first published the U.S. Small Business Administration was incorrectly identified, the reference has been corrected. (June 4, 12:08pm)
The COVID-19 pandemic resulted in one of the sharpest recessions and recoveries in U.S. history. As the virus spread over the country in a matter of weeks in March 2020, most states rapidly locked down nonessential economic activity, which plummeted as a result. As the first wave of COVID-19 subsided and people gradually learned to “live with the virus,” states reversed most of the initial lockdowns and economic activity rebounded. In our ongoing Economic Inequality series, we have explored many aspects of how the economic turmoil associated with COVID-19 differentially affected households. Here, we turn to small business experience. The first post in this three-part installment seeks to understand if there was variance in small business activity across counties that differed by income and race. In two companion posts, we investigate the experience of small businesses in terms of credit access, looking at characteristics of who received and who benefited from the Paycheck Protection Program (PPP). The analysis finds inequalities in PPP credit access as well as differences in the loan and recipient county characteristics for those who received loans through financial technology (fintech) providers versus other lenders.
Data and Background
Following earlier posts in our series, we use data on race and income composition at the county level from the 2014-18 waves of the American Community Survey to differentiate between low-income and higher-income counties, and between majority-minority (MM) and other counties. We define low-income counties as those that fall in the lowest quartile of the population-weighted distribution of median household income. We recognize also that the term “minority” does not capture racial or ethnic diversity, however, in our definition, MM counties are those in which at least half the population is Hispanic, and/or non-Hispanic Black, Asian American, Pacific Islander, or Native American.
In this post, we focus on small business revenue leveraging data from the small business data processing firm Womply. Small businesses (defined using U.S. Small Business Administration thresholds by industry) account for half of domestic GDP and employment, and are prominent in industries particularly affected by the pandemic, such as restaurants, hotels, retail shops, entertainment, and others. This analysis concentrates on total small business revenue and small business revenue in the food and accommodation sector.
Our goal is to explore differences in the pattern of small business revenues between groups of counties that differ by income and race over the pandemic. We exploit small business revenue data from Womply and track its evolution since the onset of the pandemic, separating high- and low-income counties, as well as MM from majority-nonminority (MNM) counties. We account for seasonality in the data by dividing our weekly data for each group by the corresponding data in 2019. Next, for easier comparison, we index each series to January 2020 and rescale the series to present percent changes relative to January 2020. Thus, each small business data series represents the seasonally adjusted growth in consumption in small businesses relative to the year-on-year growth obtaining in January 2020.
Differences in Small Business Revenue by Income of Counties
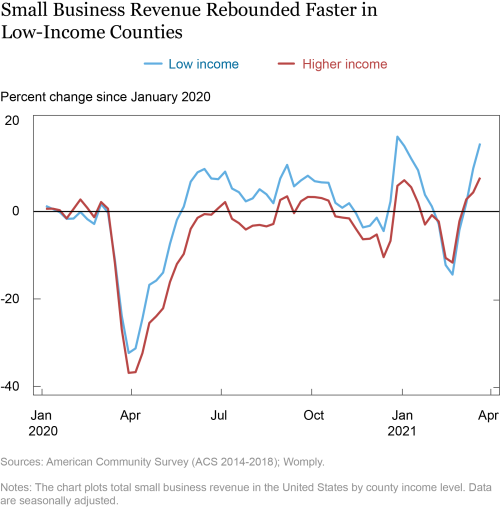
We start by looking at the differences by income in total small business economic activity and then zero in on revenue from food and accommodation. Since it is likely that customers at small businesses overwhelmingly come from the same county, we assume here that customers at small businesses in high-income areas are on average high income, and customers at small businesses in low-income counties are overwhelmingly low income. As seen in the chart below, there are no discernible differences in small business revenue growth between low-income counties and counties with higher income in the pre-COVID period. The drastic decline as the pandemic hit by March 15, 2020, is visible for all counties, but the decline is markedly larger for higher-income counties. This suggests that people in higher-income counties reduced their spending at small businesses by more than those in lower-income counties. A likely interpretation is that the “direct” effects of the pandemic, in the form of non-pharmaceutical interventions (NPIs) and social distancing, had a marginally stronger impact on small business economic activity of high-income counties. This may have happened because in-person expenditures, such as recreation, travel, and restaurant spending, comprise a larger share of high-income households’ consumption baskets. Similarly, lower-income households spend a greater proportion of their paycheck on basic necessities, and hence have less room to cut back.
We see a rapid turnaround toward recovery for all counties in April through June 2020 as social distancing restrictions were relaxed and consumers felt more comfortable in venturing out. Interestingly though, the low-income counties showed a consistently higher growth of small business revenue compared to higher-income counties. We attribute this pattern to three factors. First, unemployment assistance and income support provided to low-income individuals may have boosted spending more, at least in relative terms, in the low-income counties. An earlier Liberty Street Economics post showed how lower-wage workers, typically those working in local businesses, bore more of the brunt of job losses during the pandemic. However, supplementary unemployment benefits and stimulus checks are likely to have provided a cushion against income losses for workers in low-income counties. Coupled with higher marginal propensities to consume in these households, these benefits likely led to a steeper increase in spending at small businesses.
Second, high-income households typically save a large fraction of their income. Our findings suggest that they may have engaged even more in additional precautionary savings, possibly in response to the uncertainty caused by the pandemic. This response may have limited the consumption recovery in high-income counties.
Third, social distancing and NPIs may have had more persistent effects in high-income counties, which are likely to be urban. These factors may have affected small business revenues directly, as some activities and industries did not immediately reopen, as well as indirectly via reduced consumption of high-income households, which are more likely to consume goods and services directly constrained by social distancing.
For both groups of counties, however, we see an increase in small business revenue around the holiday season as demands pick up, with the gap by income closing up as we complete a year from the beginning of the pandemic.
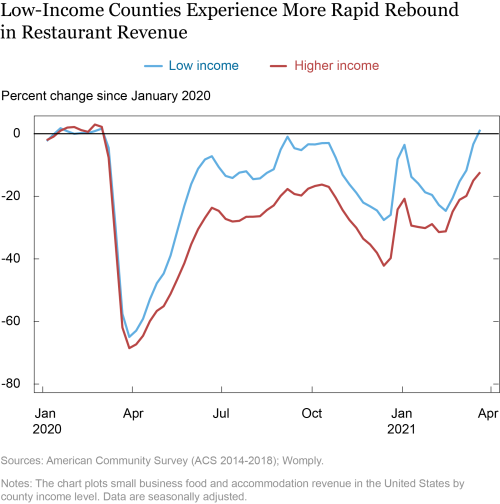
We now turn to small business revenue in food and accommodation, the sector hardest hit by the pandemic. As depicted in the chart below, the decline in food and accommodation revenue for small businesses was even more than the decline in total revenue, with this decline being slightly larger for higher-income counties. The subsequent recovery in the sector matches the story seen earlier for total revenue, although the gap that opened up between low-income and higher-income counties remained wider than for total revenue throughout early 2021. As explained before, such a pattern suggests that different households may be differentially exposed to goods and services that were directly constrained by social distancing.
Differences in Small Business Revenue by County Racial Composition
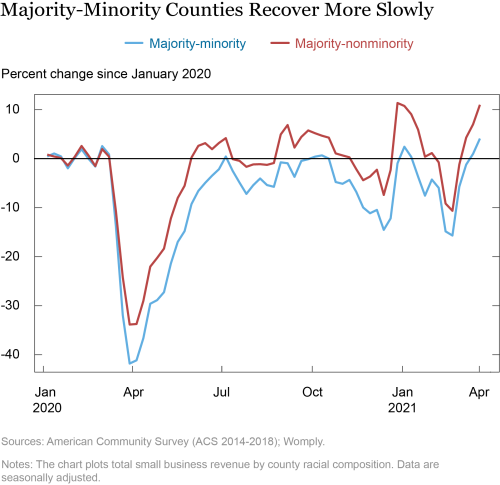
When we look at the differences in small business revenue by race, we find that MM counties saw a slightly greater decline when the pandemic hit than MNM counties did. This disparity is consistent with the fact that people in MM counties tend to live in urban areas that have higher income, and hence the pattern of MM counties is similar to that of higher-income counties. This differential is also consistent with minority-owned small businesses being disproportionately likely to close at the beginning of the pandemic and to take longer to receive loan assistance through the PPP. It is worth noting that the differences in recession and recovery paths across counties by race are similar, if not smaller than the differences across counties by income. Following the patterns above, there was a relatively quick recovery, and a similar uptick around the holiday season, with the gap in small business revenue growth between MM and MNM counties shrinking over time.
Conclusion
In this post we have looked at the trends in small businesses revenue during the course of the pandemic. All counties experienced a drastic decline in consumer spending when the pandemic hit, but the extents of declines were different as were the rates of recovery along demographic lines. The decline in revenue was perceptibly deeper in high-income counties and in MM counties in the initial weeks of the pandemic. As the economy recovered, the recovery was sharper in low-income counties and MNM counties. These differences are consistent with differential experience with unemployment assistance and stimulus checks along with different abilities to save and differences in access to PPP loans. Our results also highlight that the pandemic-related recession and recovery of small business revenue tallies with the pattern with which aid relevant to small businesses was disbursed, and underscore the CARES Act relief measures, including unemployment insurance benefits expansion and stimulus checks, as having been important for economic recovery. The next posts in the series explore the credit access side, looking further at small business participation in the PPP loan program, whether smaller firms received the amount of PPP credit they requested, and whether loans went to the hardest-hit areas and mitigated job losses.
Ruchi Avtar is a senior research analyst in the Federal Reserve Bank of New York’s Research and Statistics Group.
 Rajashri Chakrabarti is a senior economist in the Bank’s Research and Statistics Group.
 Davide Melcangi is an economist in the Research and Statistics
Group.
 Maxim Pinkovskiy is a senior economist in the Research and Statistics Group.
 Giorgio Topa is a vice president in the Research and Statistics Group.
How to cite this post:
Additional Posts in this Series
Who Received PPP Loans by Fintech Lenders?
Who Benefited from PPP Loans by Fintech Lenders?
Press Briefing

Disclaimer
The views expressed in this post are those of the authors and do not necessarily reflect the position of the Federal Reserve Bank of New York or the Federal Reserve System. Any errors or omissions are the responsibility of the authors.


 RSS Feed
 Follow Liberty Street Economics