


This post presents an updated estimate of inflation persistence, following the release of personal consumption expenditure (PCE) price data for April 2023. The estimates are obtained by the Multivariate Core Trend (MCT), a model we introduced on Liberty Street Economics last year and covered most recently in a May post. The MCT is a dynamic factor model estimated on monthly data for the seventeen major sectors of the PCE price index. It decomposes each sector’s inflation as the sum of a common trend, a sector-specific trend, a common transitory shock, and a sector-specific transitory shock. The trend in PCE inflation is constructed as the sum of the common and the sector-specific trends weighted by the expenditure shares.
MCT Declined in April
The MCT declined to 3.4 percent in April from 3.6 percent in March (the value for March was itself revised down considerably from 4.5 percent). Uncertainty is high as reflected in the 68 percent probability band (shaded area) of (3.0, 4.0) percent. By comparison, the standard twelve-month core PCE measure inched up to 4.7 percent in April following monthly readings of 0.4 percent in April and 0.3 percent in March.
PCE and Multivariate Core Trend
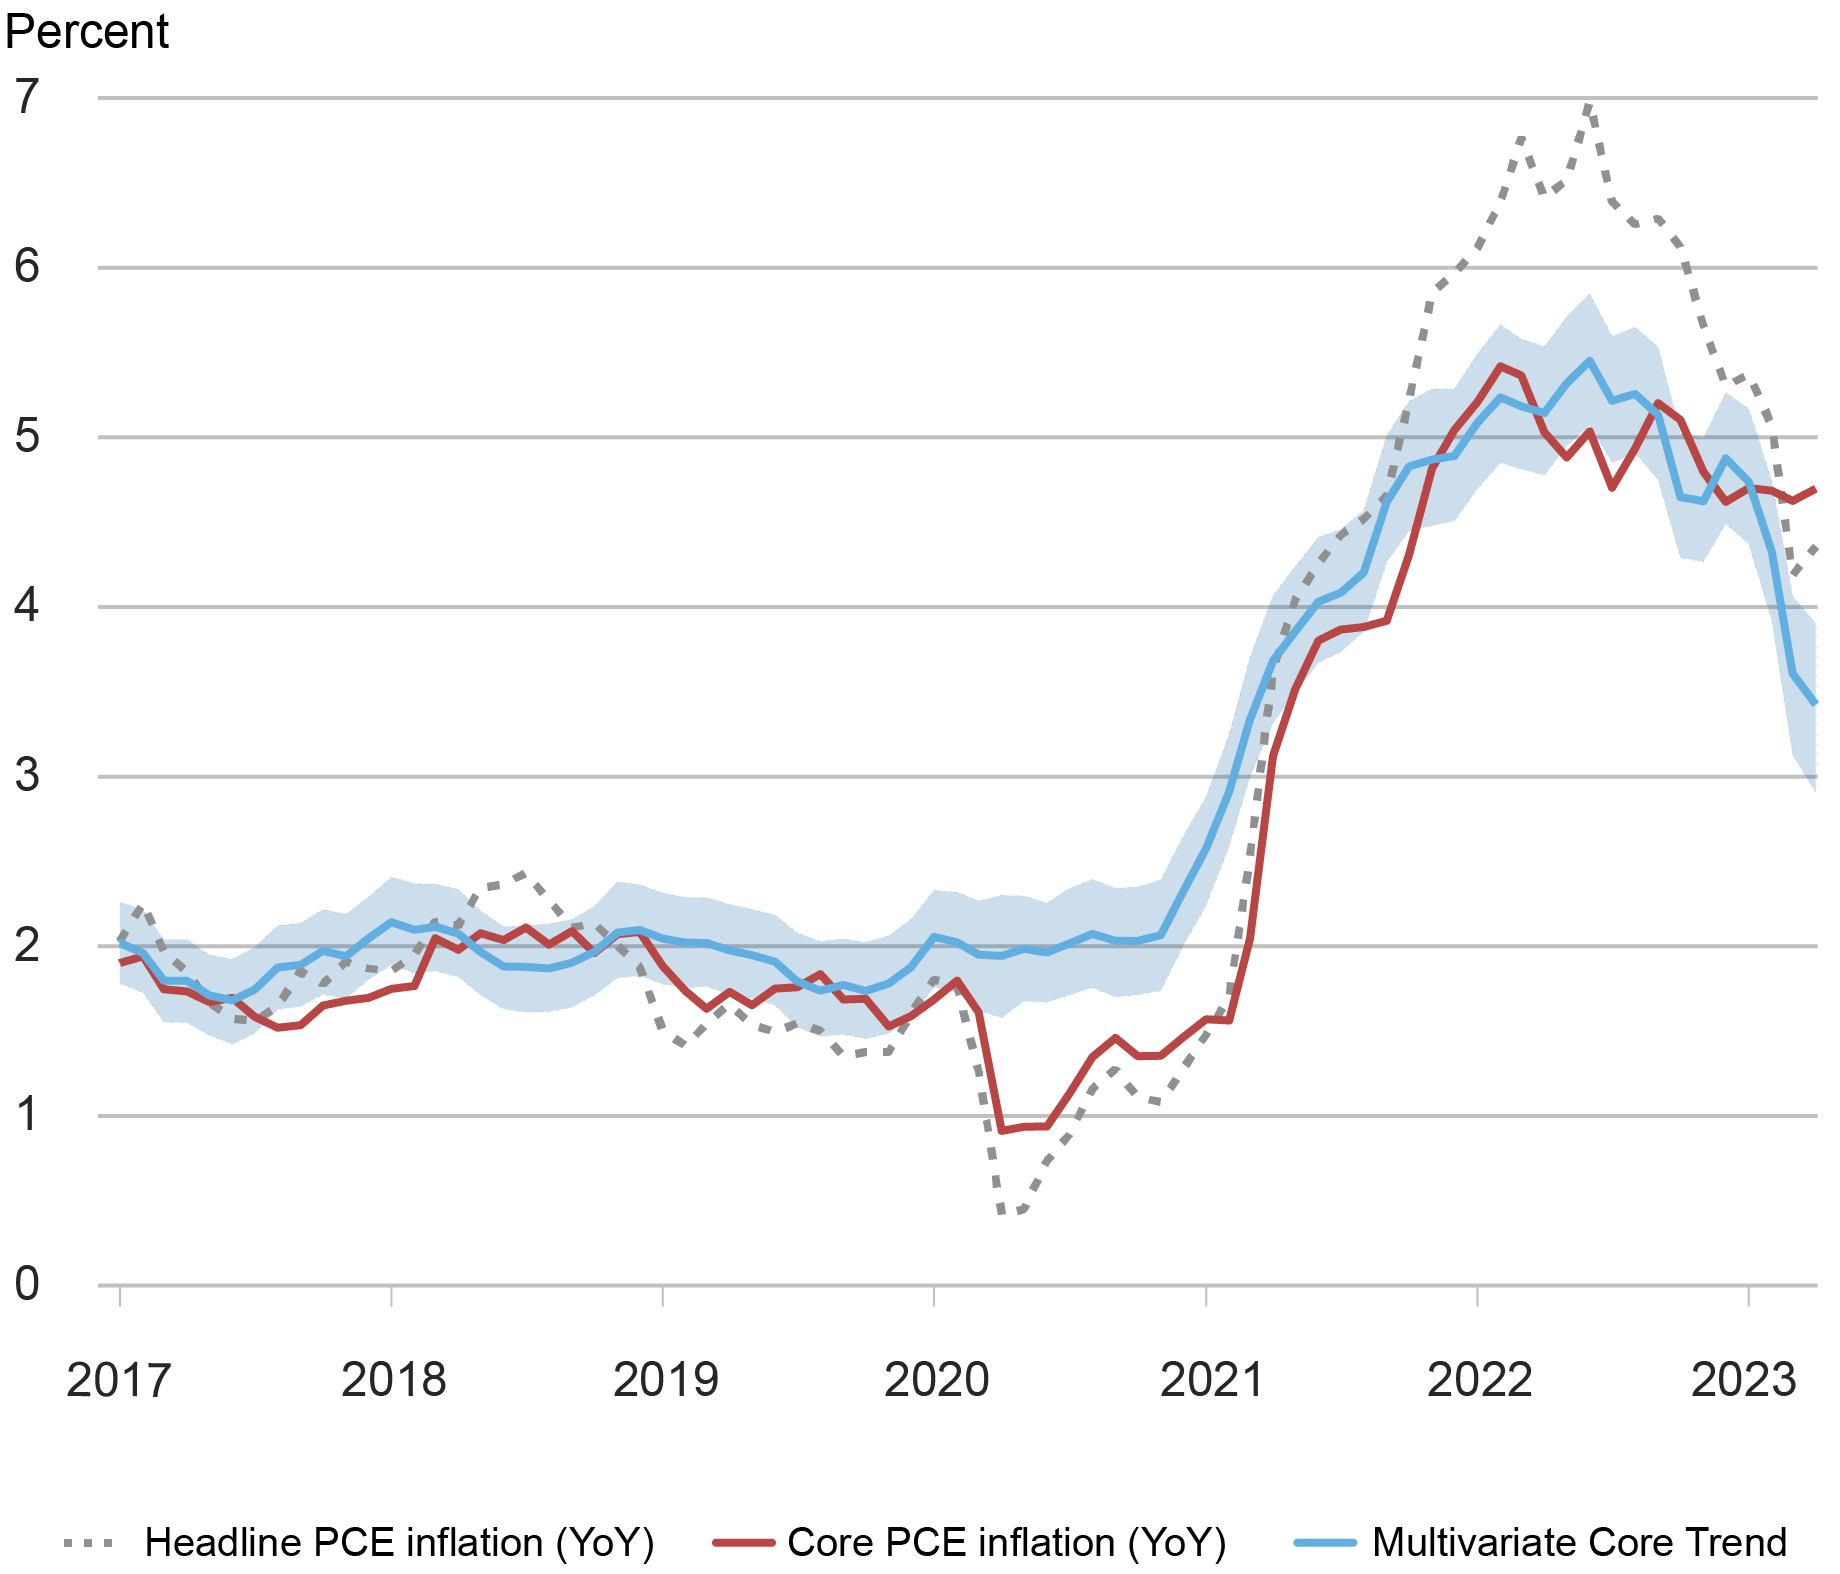
Notes: PCE is personal consumption expenditure. The shaded area is a 68 percent probability band.
The latest MCT estimates revised down the recent path for inflation persistence: from October 2022 to January 2023 the trend held steady at a level close to 4¾ percent, after exceeding 5 percent during most of 2022. Since January 2023, the trend has been on a steep decline. The sectoral decomposition shows that the decline in the trend was initially due to decline in core goods and non-housing services inflation; in the last three months, however, a substantial moderation in housing played the biggest role.
To be more precise, the trend in housing inflation declined to 6.6 percent in April from 6.9 percent in March (this value was itself revised down from 8.3 percent) following the moderation in monthly inflation readings. The trends in goods and services also continued to decline. The contribution of housing inflation to the increase in the persistent component of inflation from the onset of the pandemic, at about 0.5 percentage point (ppt), is now below the cumulative contribution of services ex-housing (0.7 ppt) and above that of goods (0.3 ppt), as shown in the following chart.
Inflation Trend Decomposition: Sector Aggregates
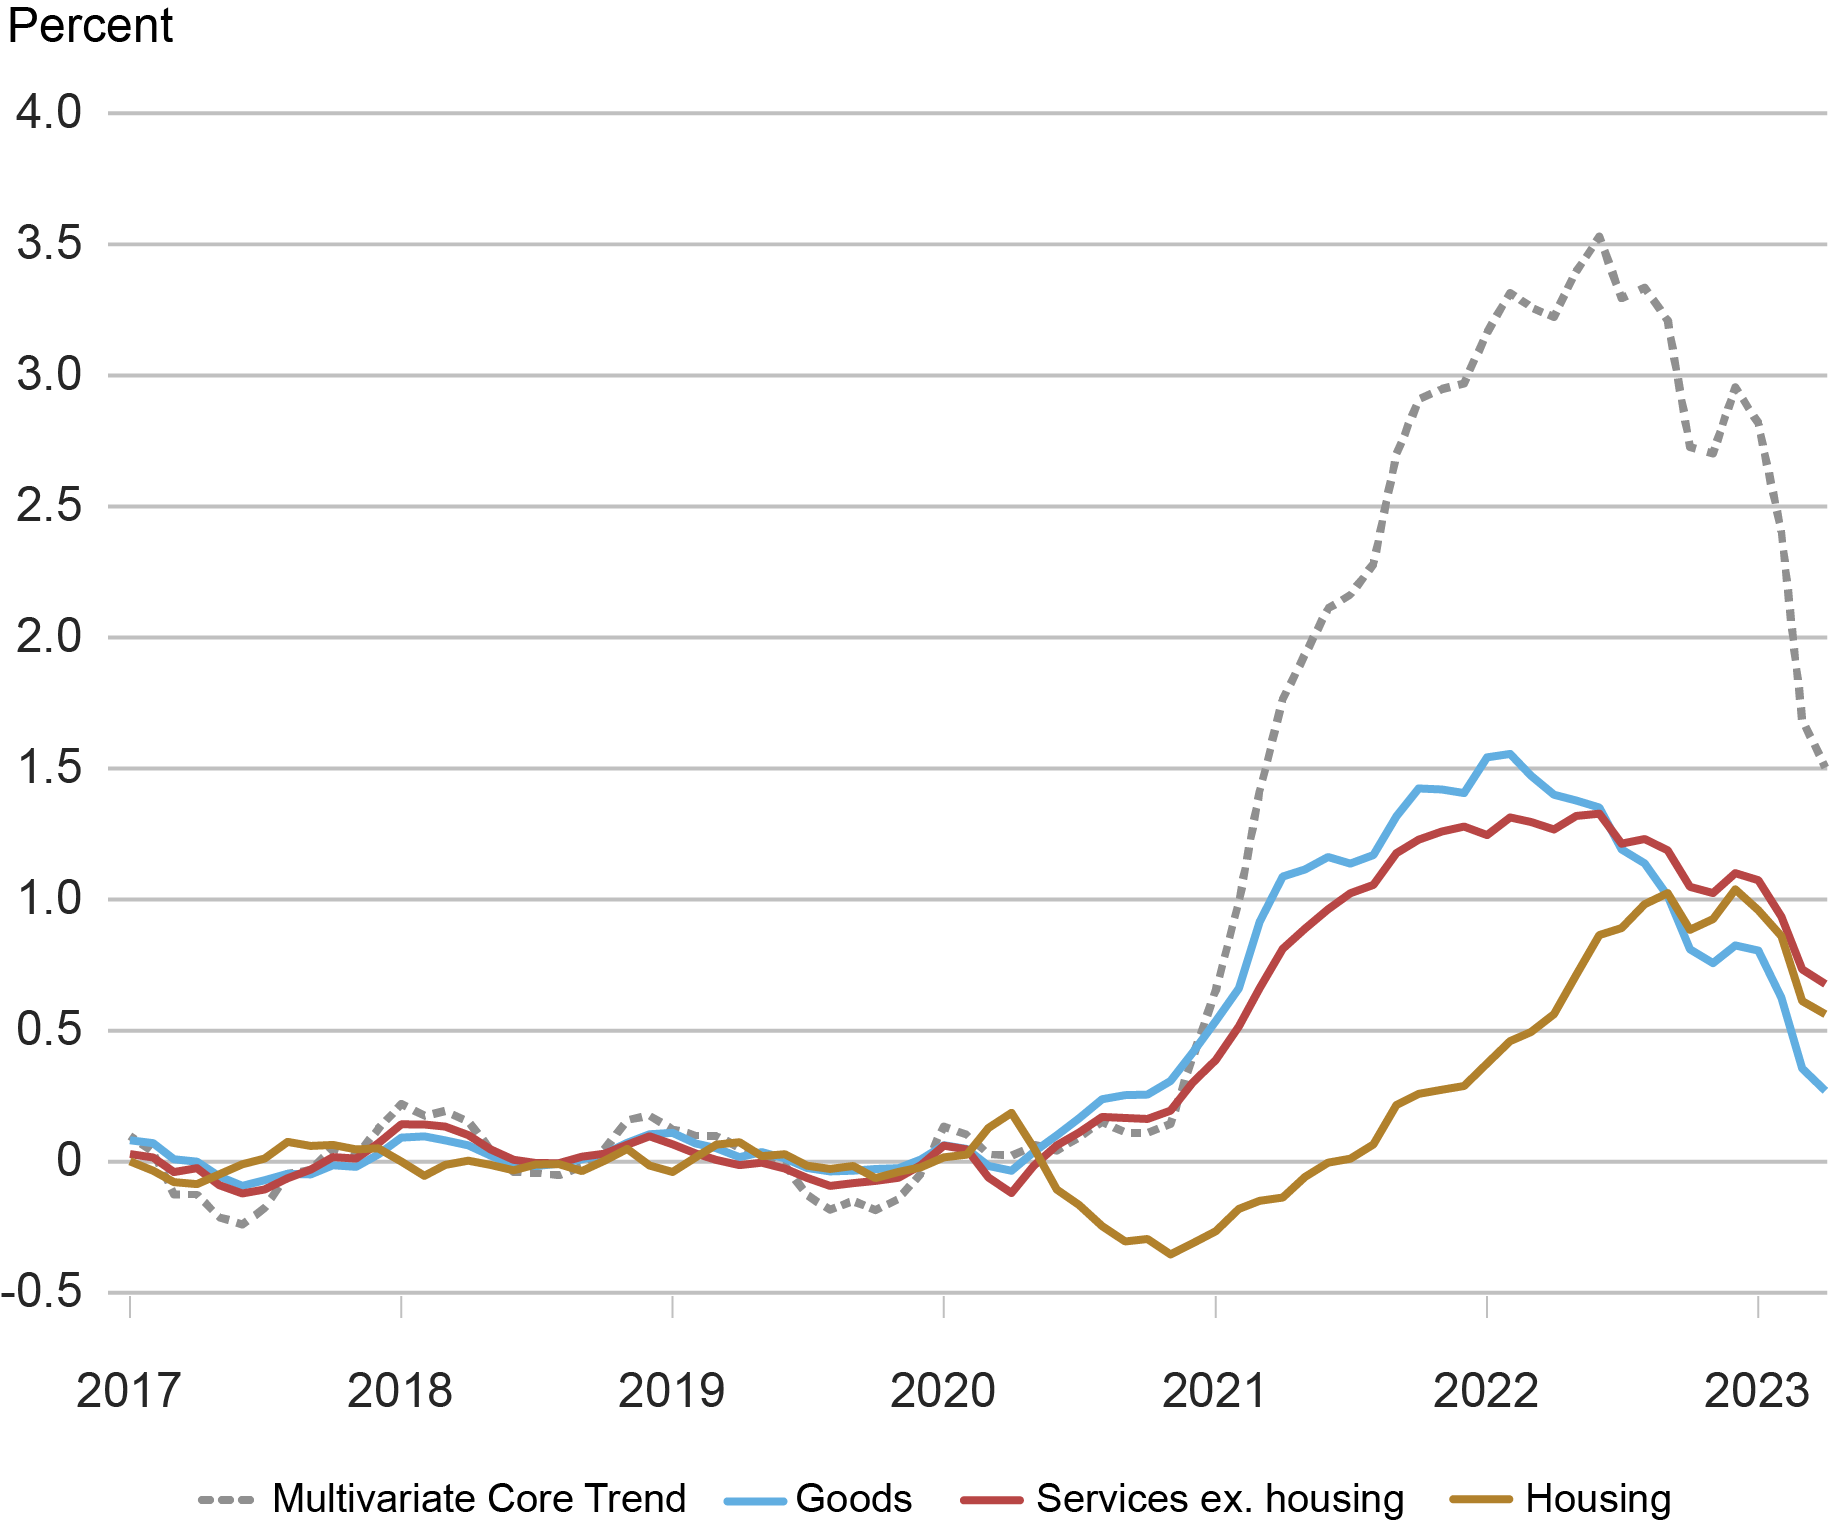
Note: The base for the calculation of the contribution to the change in the Multivariate Core Trend is the average over the period January 2017-December 2019.
It is worth noting that the MCT model has a somewhat optimistic reading of April inflation data, since it “looks through” the April pickup in core goods and core services, as measured by the twelve-month data (see the panel chart below).
Sectoral Inflation: PCE vs. Trend Component
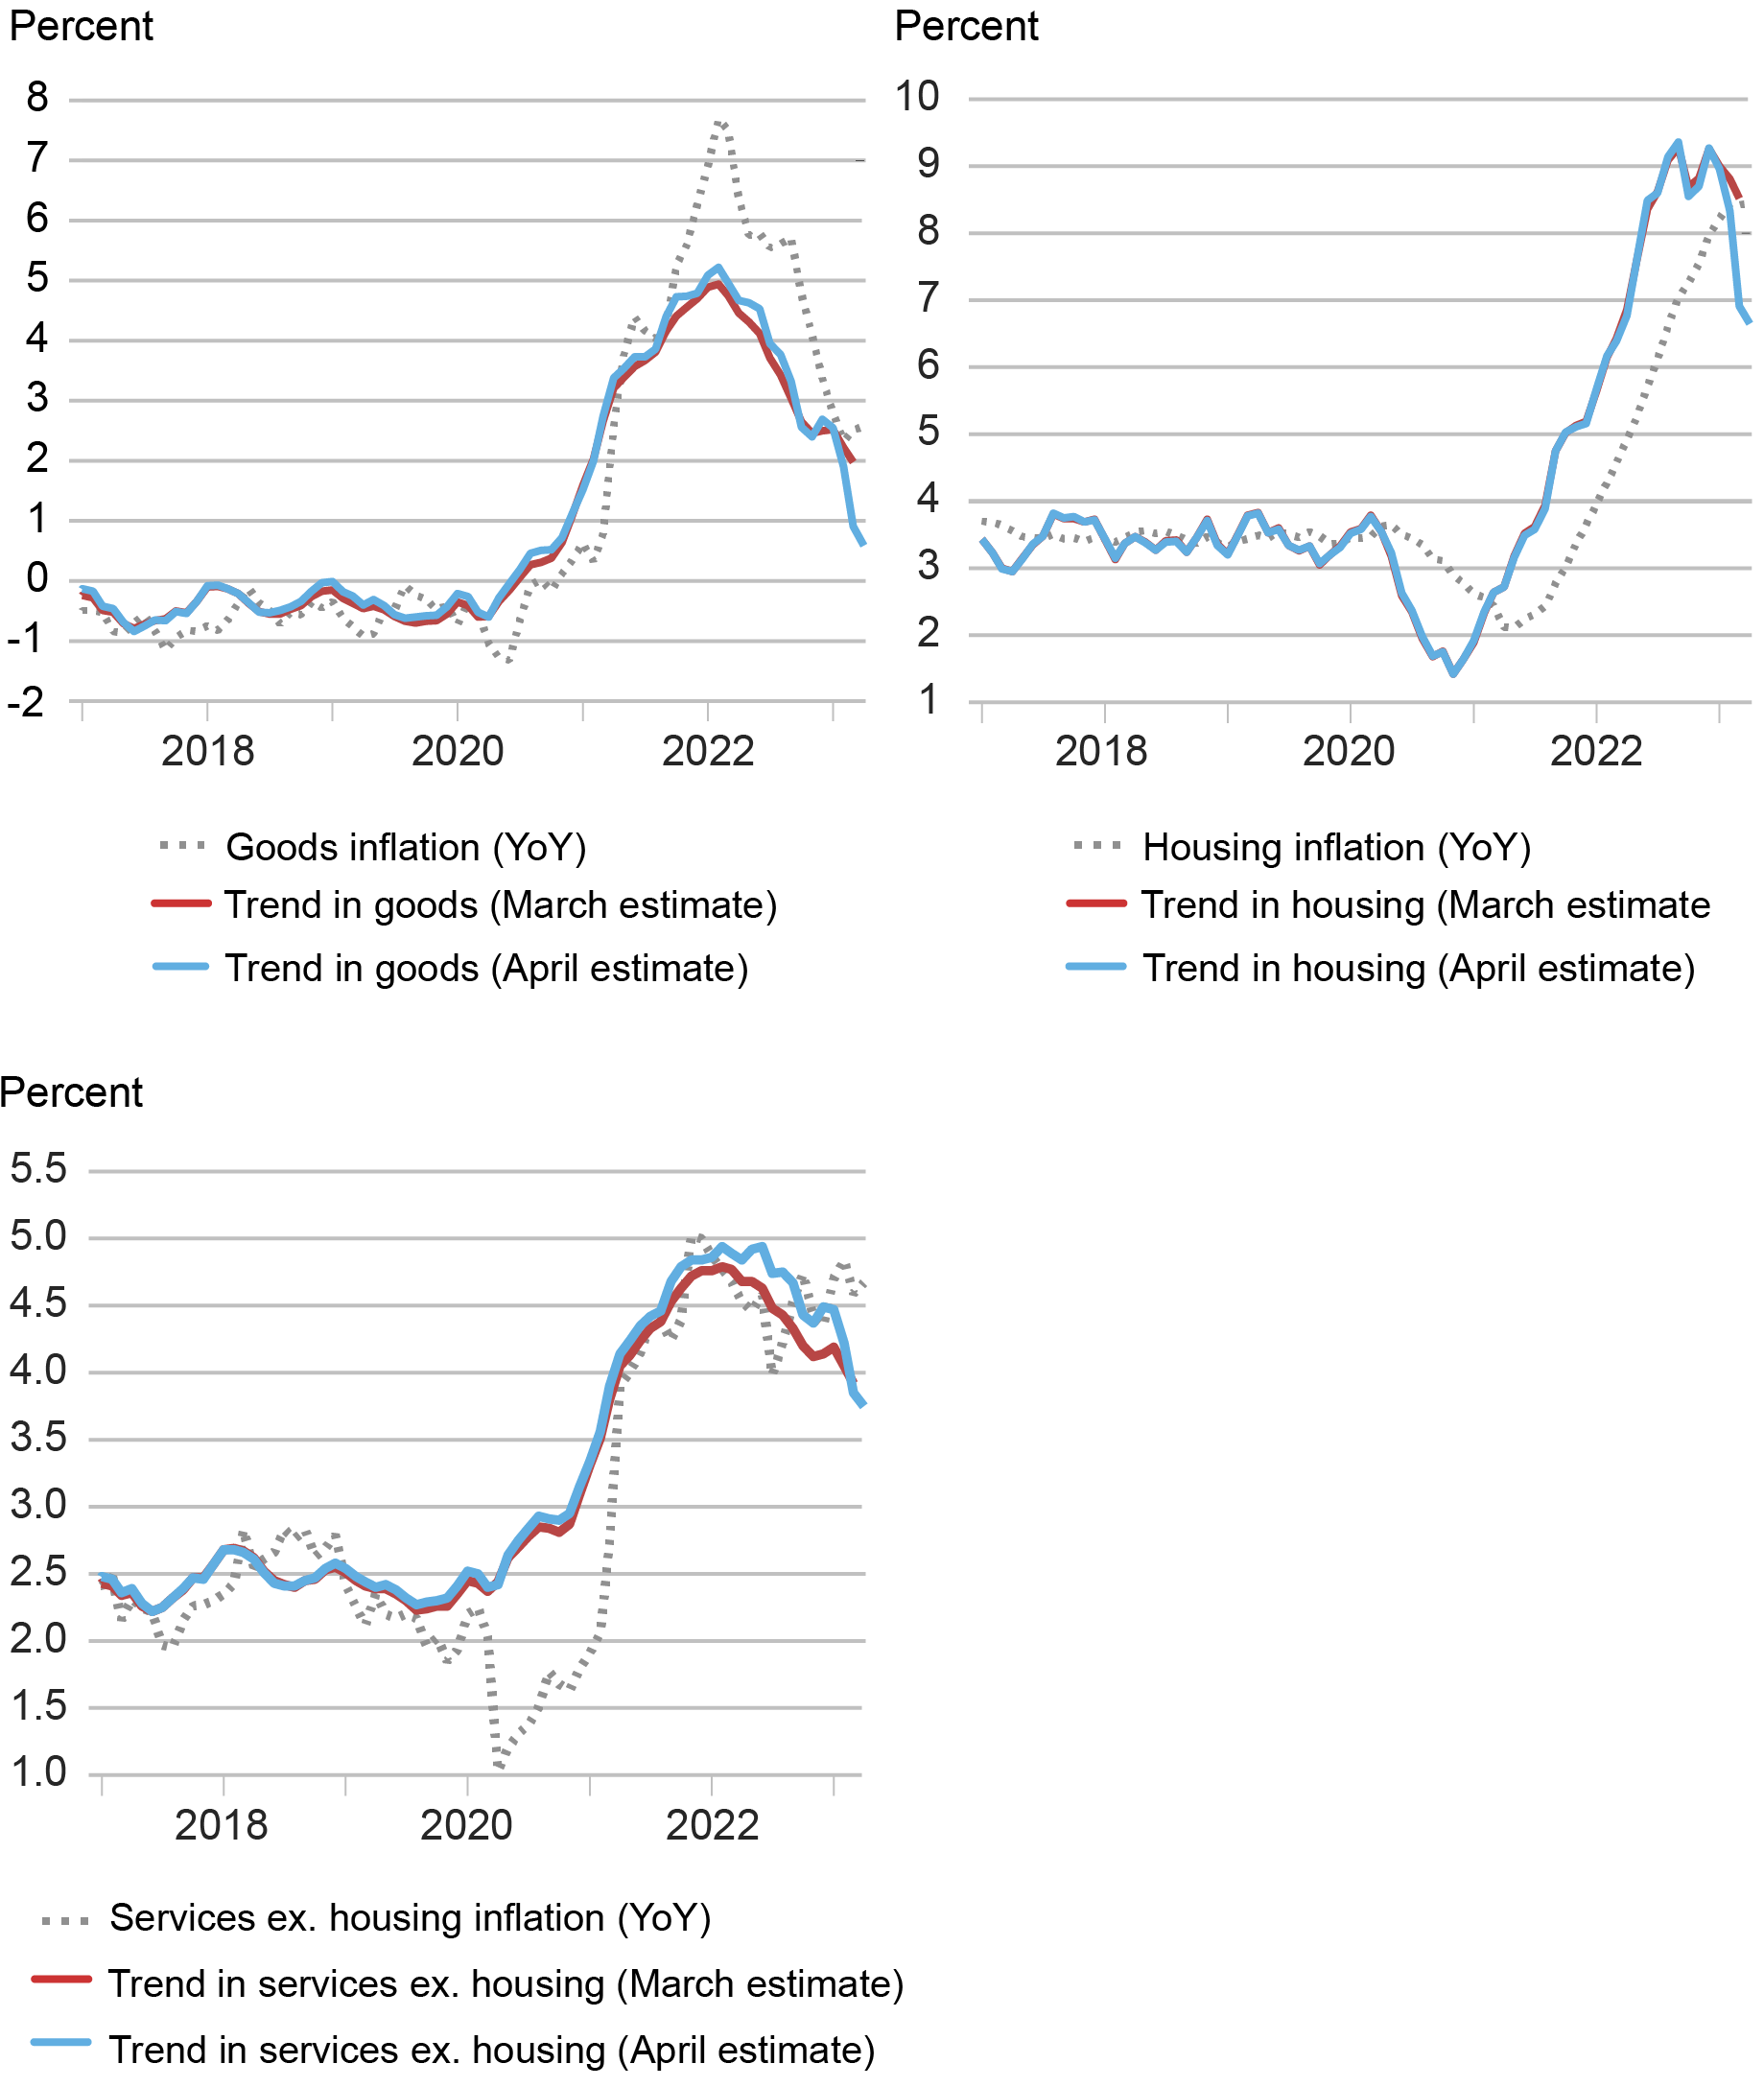
Note: PCE is personal consumption expenditure.
Finally, in terms of the source of inflation persistence, in our previous posts we documented an important difference across sectors: core goods and services ex-housing persistence was driven mostly by the common component and the sector-specific trend dominated housing inflation. This assessment still holds broadly, but the recent MCT estimates provide new insights. First, while the sector-specific component is still predominant in the housing inflation trend, a common component is detected as well (which peaked in early 2022 and is now declining in line with the common component of core goods and services ex-housing). Second, a sector-specific component has now emerged in the services ex-housing inflation and it is increasing. These insights can be seen in the next chart.
Finer Inflation Trend Decomposition
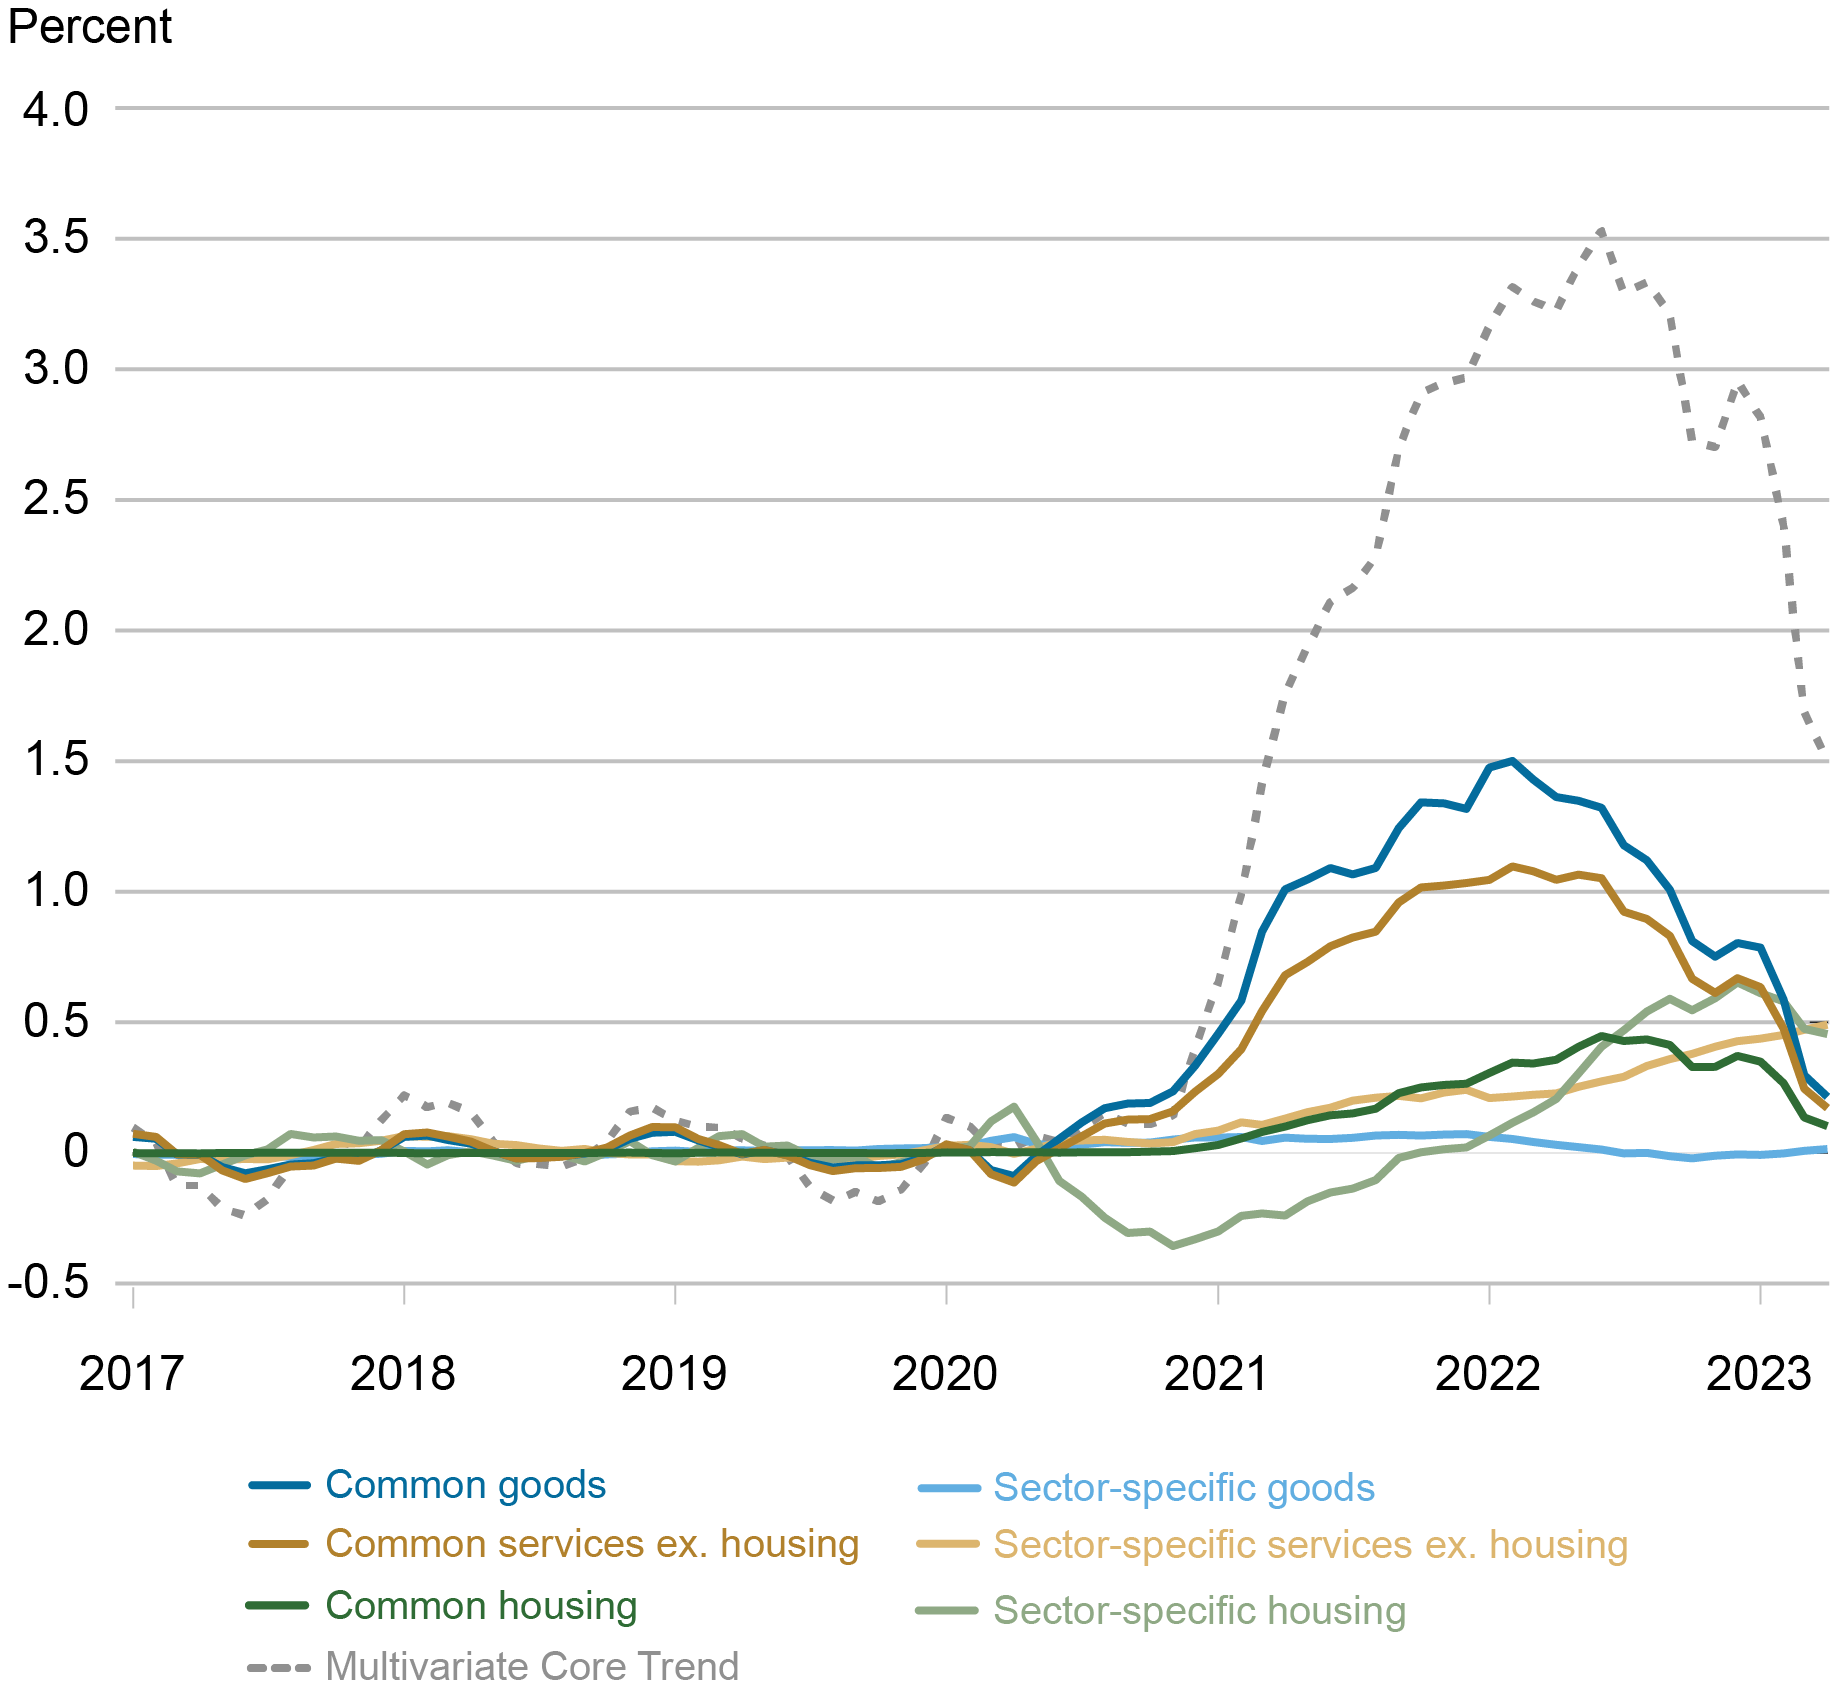
Note: The base for the calculation of the contribution to the change in the Multivariate Core Trend is the average over the period January 2017-December 2019.
We will provide a new update of the MCT and its sectoral insights after the release of May PCE data.

Martín Almuzara is a research economist in Macroeconomic and Monetary Studies in the Federal Reserve Bank of New York’s Research and Statistics Group.

Babur Kocaoglu is a senior research analyst in the Federal Reserve Bank of New York’s Research and Statistics Group.

Argia Sbordone is the head of Macroeconomic and Monetary Studies in the Federal Reserve Bank of New York’s Research and Statistics Group.
How to cite this post:
Martin Almuzara, Babur Kocaoglu, and Argia Sbordone, “MCT Update: Inflation Persistence Declined Significantly in April,” Federal Reserve Bank of New York Liberty Street Economics, June 2, 2023, https://libertystreeteconomics.newyorkfed.org/2023/06/mct-update-inflation-persistence-declined-significantly-in-april/
BibTeX: View |


Disclaimer
The views expressed in this post are those of the author(s) and do not necessarily reflect the position of the Federal Reserve Bank of New York or the Federal Reserve System. Any errors or omissions are the responsibility of the author(s).
 RSS Feed
 Follow Liberty Street Economics