


The Federal Open Market Committee (FOMC) communicates the stance of monetary policy through a target range for the federal funds rate, which is the rate set in the market for uncollateralized short-term lending and borrowing of central bank reserves in the U.S. Since the global financial crisis, the market for federal funds has changed markedly. In this post, we take a closer look at who is currently trading in the federal funds market, as well as the reasons for their participation.
The Fed Funds Market
The federal funds (or fed funds) market enables depository institutions to directly trade central bank reserves in the U.S. In this market, depository institutions and other financial entities—mainly government-sponsored enterprises (GSEs)—borrow and lend funds on an uncollateralized basis, typically with overnight maturity. The fed funds market is key for monetary policy implementation and has historically played an important role in the redistribution of reserves across the banking system. Prior to 2008, reserves were in the tens of billions of dollars and the fed funds market was very active, with participants consistently borrowing, lending, and intermediating throughout the day to meet their statutory reserve requirements. Effective October 1, 2008, Congress gave the Fed the authority to pay depository institutions interest on their reserve balances. In addition, the Fed has expanded its balance sheet to support the U.S. economy—first during the global financial crisis and more recently during the COVID-19 pandemic—leading to reserves reaching $4 trillion in late 2021, as discussed in this post. In this new environment, the need to actively borrow in the fed funds market has waned. Daily trading volume dropped from around $150-$175 billion, or around 2 percent of commercial bank assets, prior to 2008 (as estimated in this post) to around $60-$80 billion per day in the 2010s, increasing to an average of $110 billion, or 0.5 percent of bank assets, per day in 2023.
With reserves elevated in the banking system, who is now borrowing and lending in the fed funds market? And why?
Borrowers in the Fed Funds Market
As the chart below shows, the main borrowers in the fed funds market are the U.S. branches and agencies of foreign banks (FBO branches). Since 2016, FBO branches have borrowed around $45-$110 billion per day, representing between 65 and 95 percent of the total daily volume in the fed funds market. FBO branches are the most common structure of foreign banking in the U.S., and they generally engage in activities similar to those of domestic banks.
FBO Branches Are the Main Borrowers in the Fed Funds Market
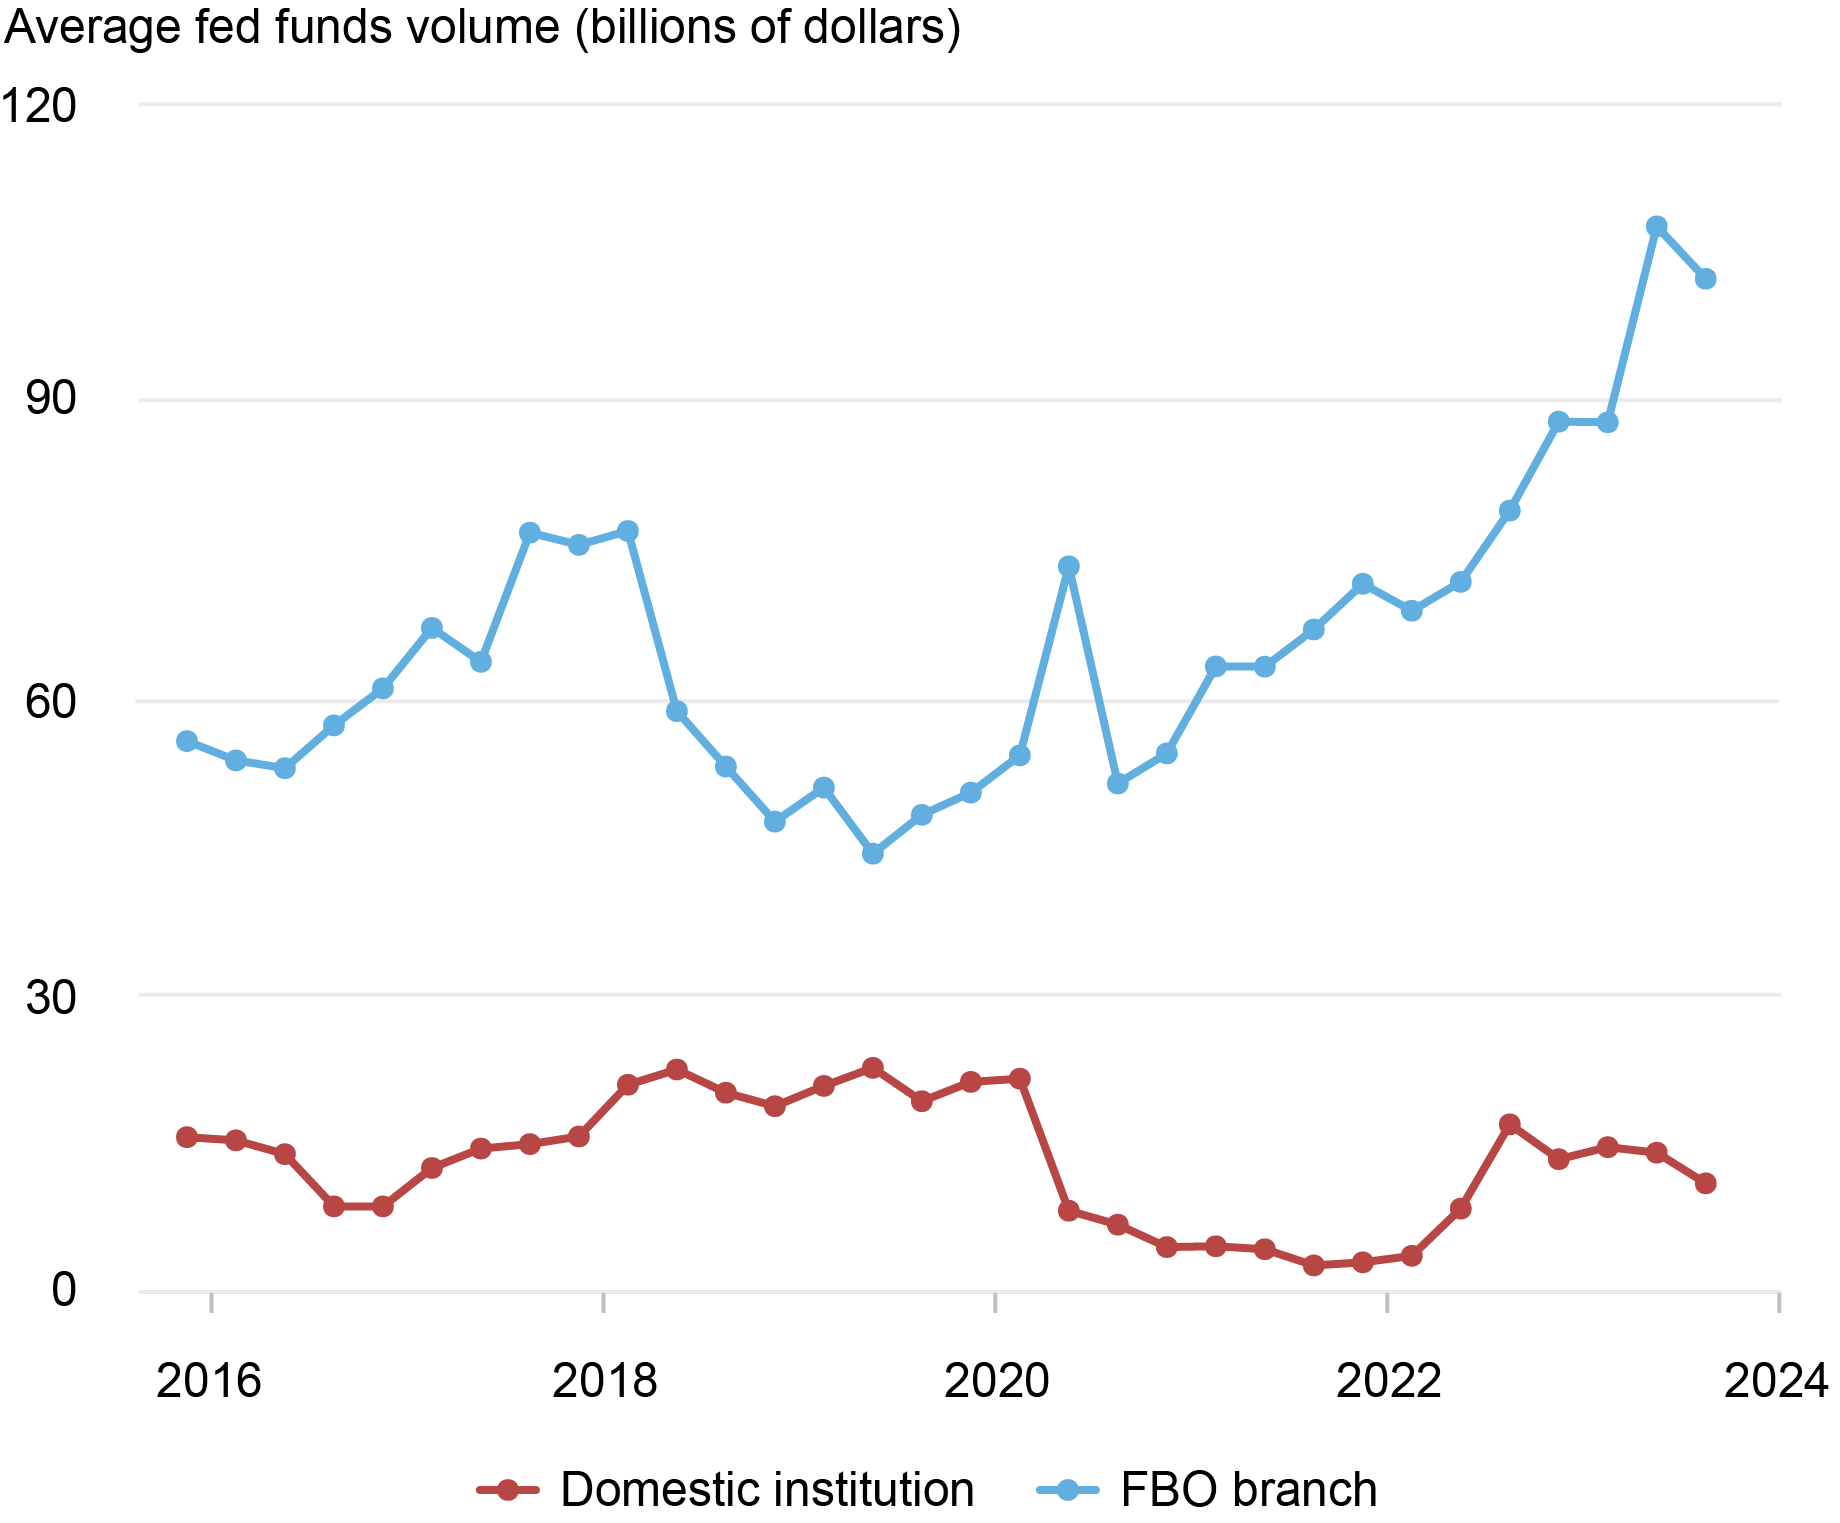
Sources: Federal Reserve Form FR 2420, Report of Selected Money Market Rates; authors’ calculations.
Note: The chart shows quarterly average federal funds volume by borrower type from the fourth quarter of 2015 through the third quarter of 2023.
Unlike domestic banks, however, most FBO branches are not insured by the Federal Deposit Insurance Corporation (FDIC) after amendments to the International Banking Act disallowed new branches of FBOs from obtaining deposit insurance. This regulatory difference has two important implications for why FBO branches borrow in the fed funds market: First, it limits their access to deposits—the main source of domestic bank funding—making fed funds an important source of their short-term funding. Second, since they do not pay the FDIC assessment fee, most FBO branches face an effective cost of borrowing fed funds that is lower than that of domestic banks. Lower funding costs give FBO branches an advantage over their domestic counterparts in arbitraging fed funds offered at rates below the interest on reserve balances (IORB) rate, as they can effectively earn a larger spread by borrowing fed funds and depositing the borrowed funds at the Fed. Furthermore, differences in regulatory requirements across jurisdictions make engaging in the arbitrage trade less costly and less capital intensive for FBO branches. Specifically, leverage ratios in foreign jurisdictions are often calculated as a period-end snapshot, as opposed to daily or weekly averages in the U.S., which allows FBO branches more flexibility to borrow between reporting dates and simply unwind their positions on month-end or quarter-end dates to maintain higher reported leverage ratios.
The chart above shows that domestic banks are also borrowers in the fed funds market. Borrowing by domestic banks ranged from $2.5 billion in late 2021 to $25 billion in mid-2019, representing between 5 and 35 percent, respectively, of the total daily volume of fed funds traded.
As shown in the next chart, their borrowing increases when aggregate reserves decline. This finding is consistent with results from the November 2022 Senior Financial Officer Survey (SFOS), where more than 70 percent of domestic banks responded that they were likely or very likely to borrow in unsecured funding markets—including the fed funds market—as a way to build liquidity if their level of reserve balances were to fall below a minimum threshold (see this summary of the SFOS results).
Fed Funds Borrowing Increases as Aggregate Reserves Decline
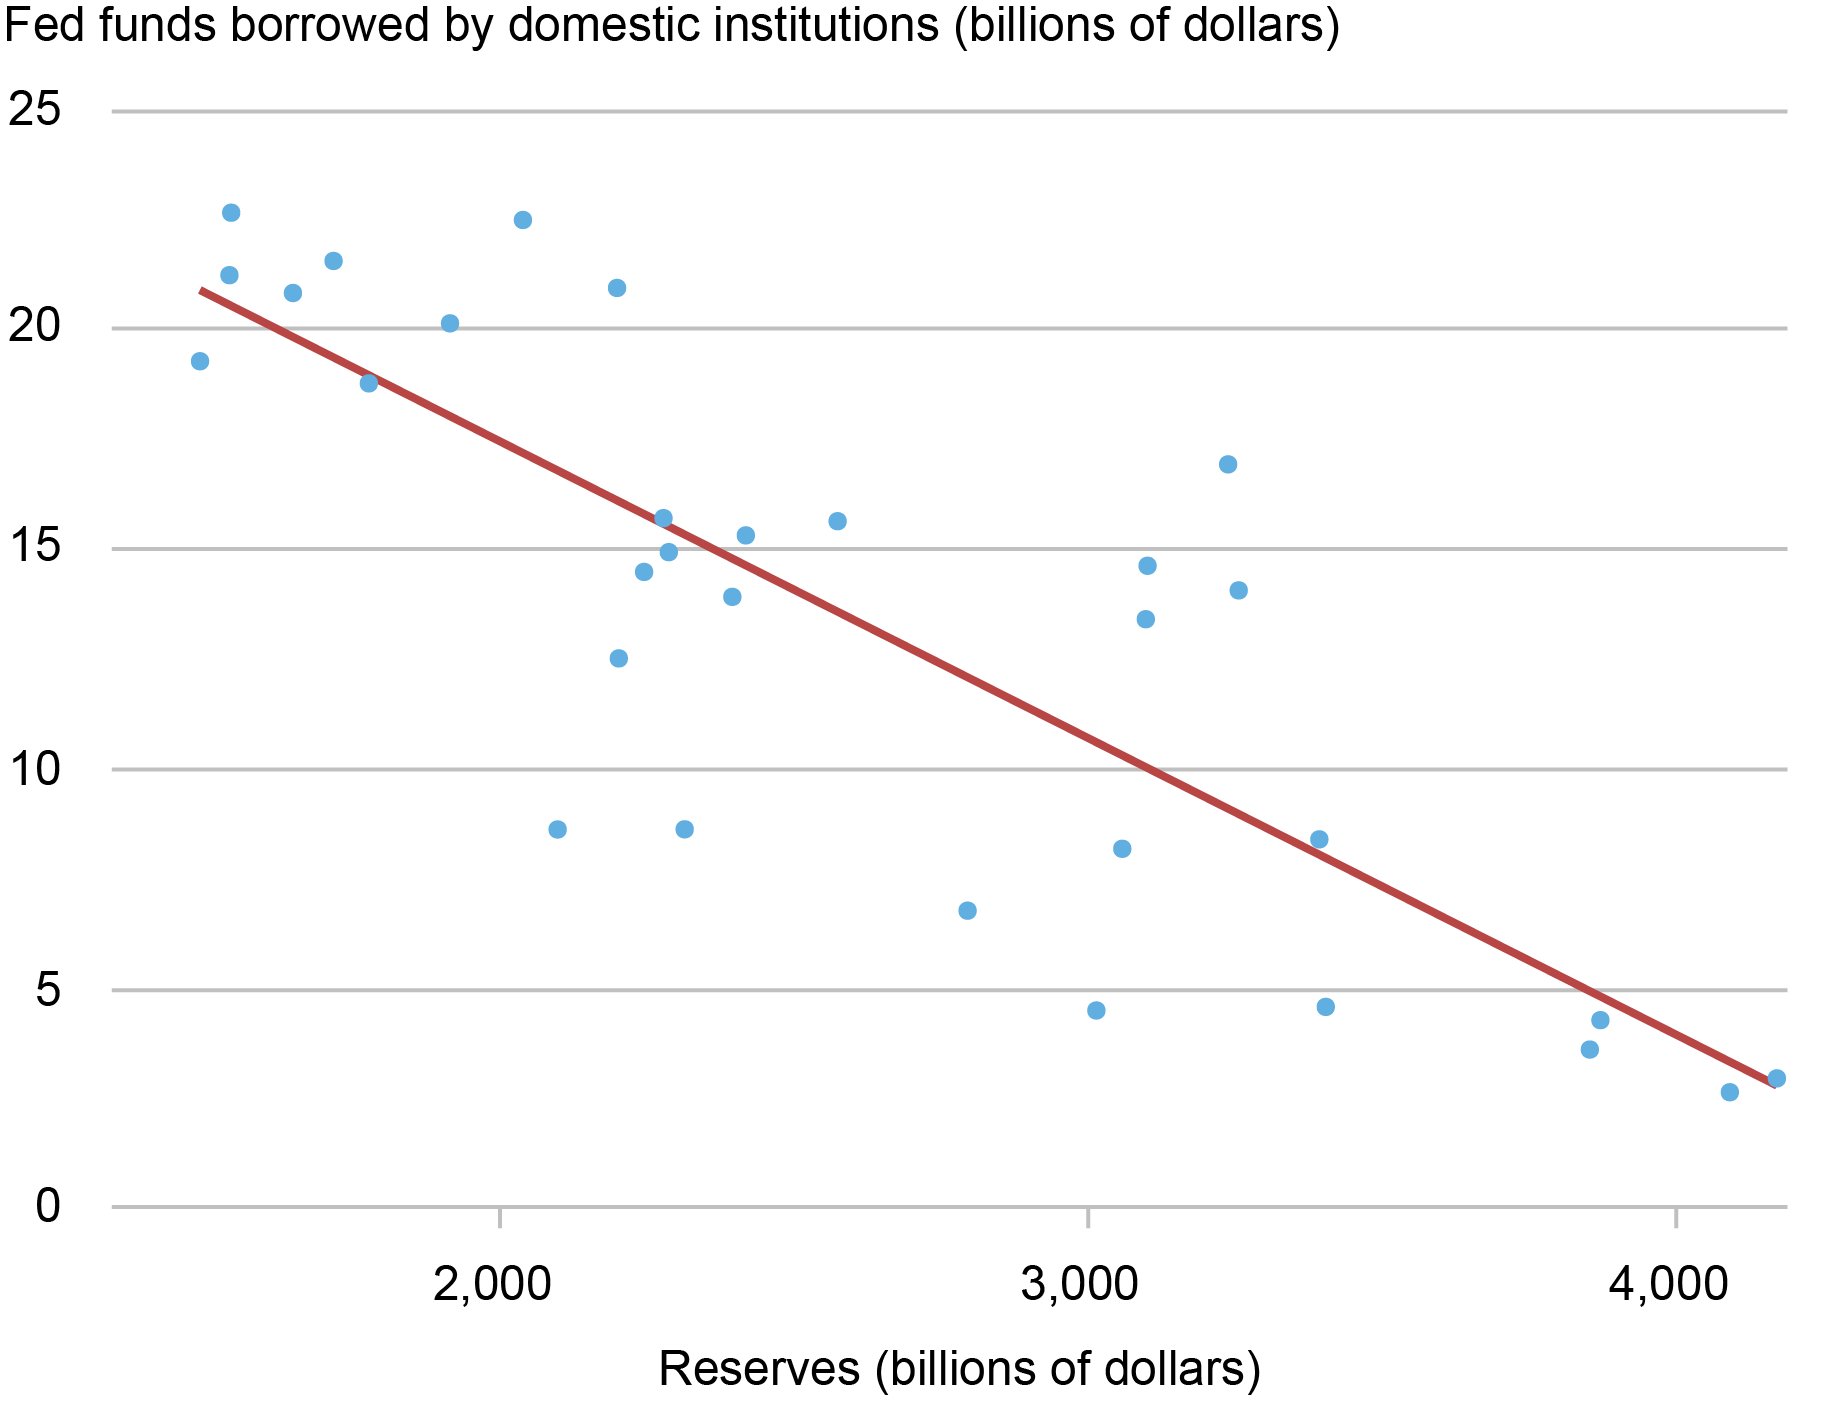
Sources: Federal Reserve Bank of St. Louis, FRED database; authors’ calculations.
Note: Reserves figures are quarterly averages.
Who’s Lending in the Fed Funds Market?
Federal Home Loan Banks (FHLBs) are the top lenders in the fed funds market. The FHLBs are GSEs that support mortgage lending and community investments and are organized as cooperatives owned by their members. The eleven FHLBs raise funds in global markets through the sale of debt securities that they then lend to their members through collateralized loans (called “advances”), which represent around two-thirds of their total assets (see the FHLB financial reports). As the next chart shows, GSEs dominate lending in the fed funds market and are responsible for more than 90 percent of the total daily volume of fed funds traded.
FHLBs Are the Main Lenders in the Fed Funds Market
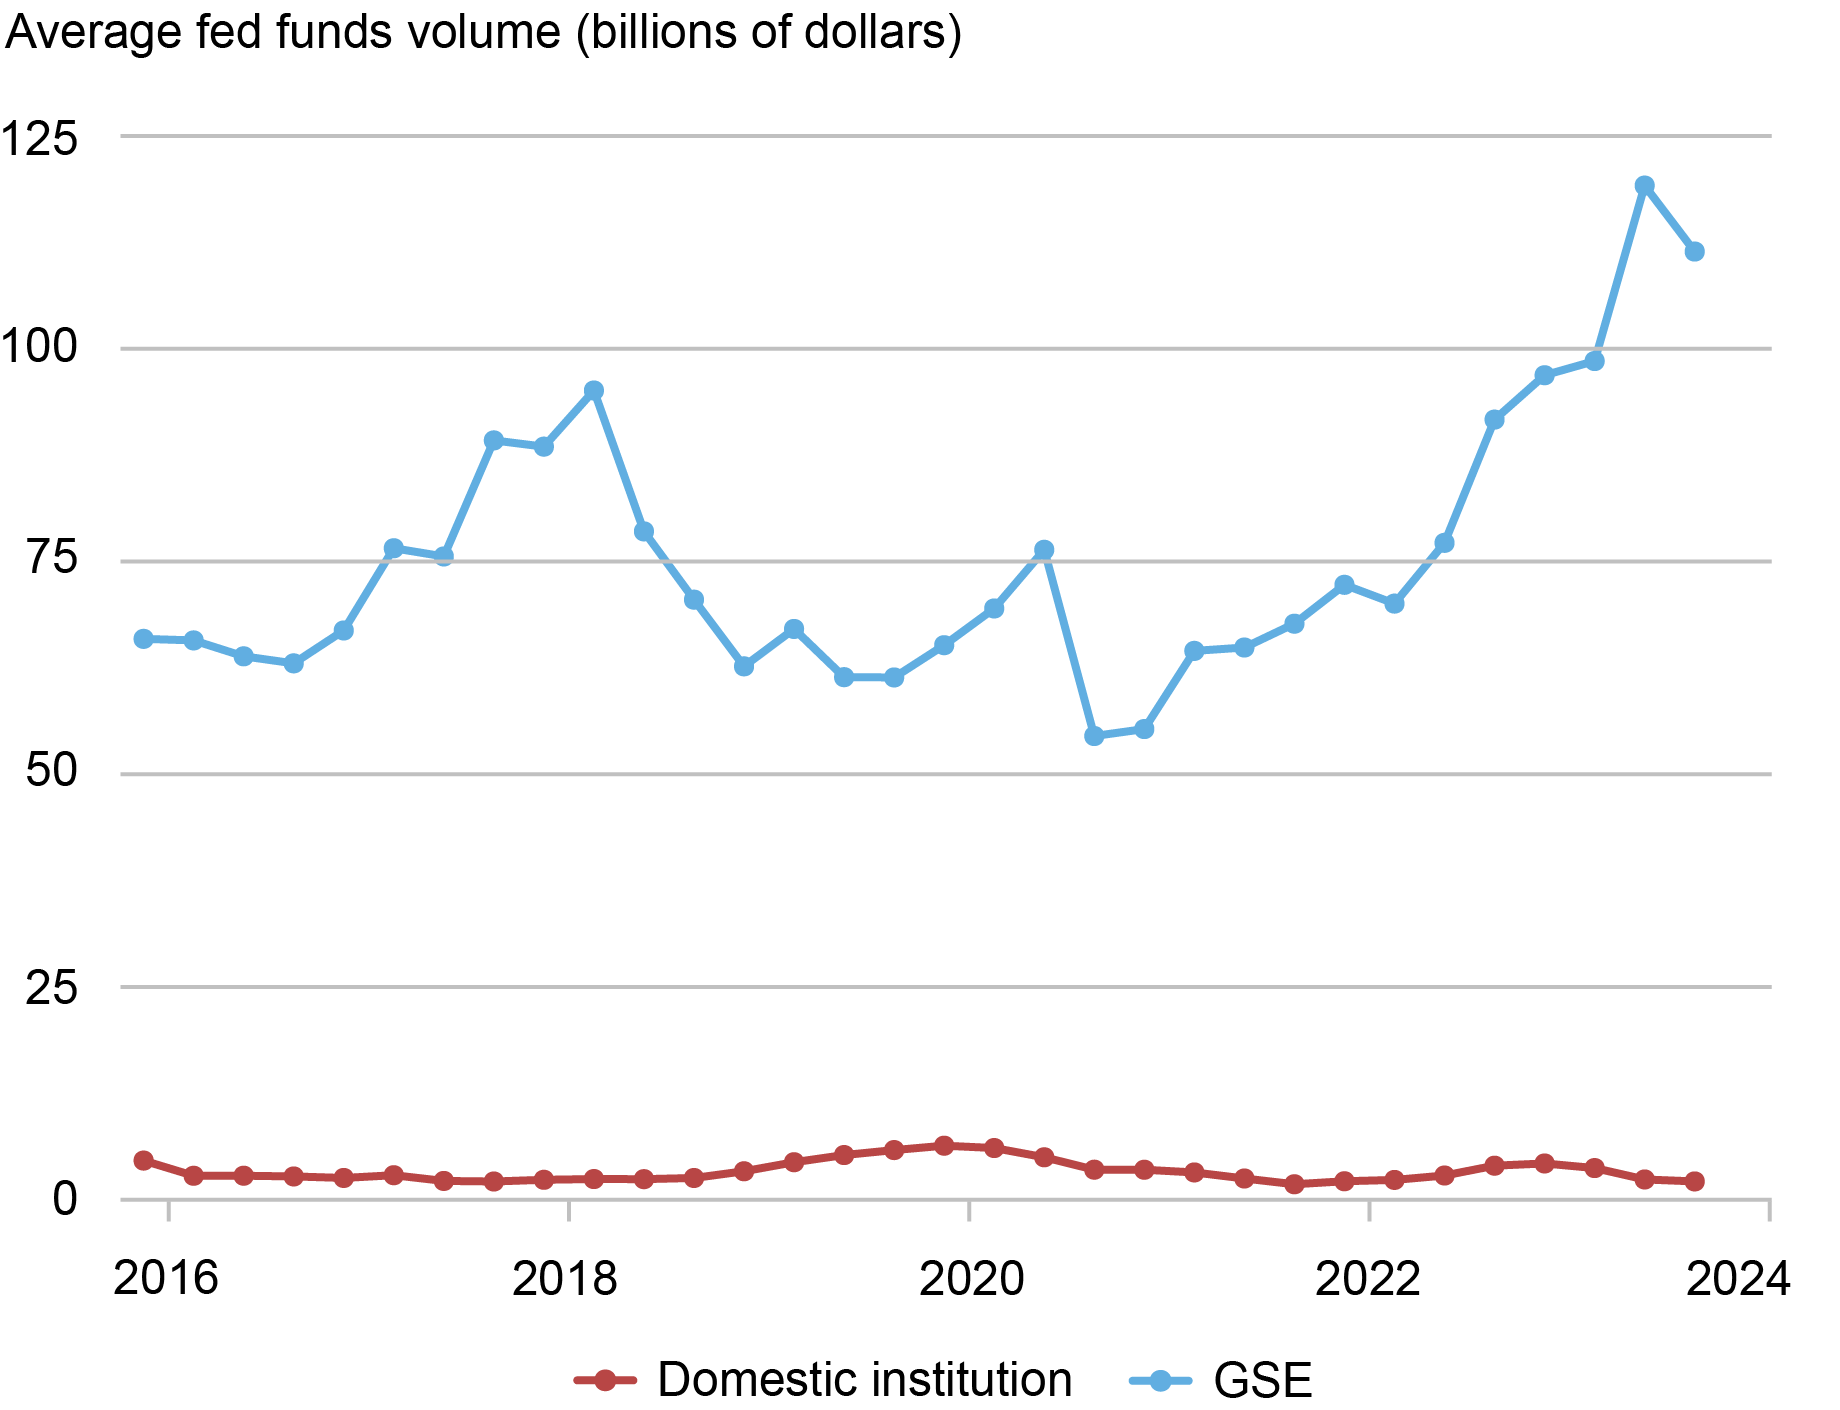
Sources: Federal Reserve Form FR 2420, Report of Selected Money Market Rates; authors’ calculations.
Note: The chart shows quarterly average federal funds volume by lender type from the fourth quarter of 2015 through the third quarter of 2023.
Two primary factors contribute to FHLBs’ willingness to lend in the fed funds market. First, FHLBs must hold liquidity portfolios—partly to meet minimum regulatory requirements, but also to satisfy advances to their members. Fed funds are key instruments in such portfolios, along with interest-bearing deposit accounts and other selected short-term investments such as reverse repos. This means that FHLBs turn to the fed funds market to invest excess cash holdings. Second, unlike domestic banks and FBO branches, FHLBs do not earn interest on their balances at the central bank, which creates an incentive for them to lend at rates below the IORB rate. In turn, this incentive to lend at low rates triggers the arbitrage mechanism between fed funds rates and the IORB rate, making it a regular phenomenon rather than an anomaly.
Two additional points are noteworthy here. First, since FHLBs have access to the overnight reverse repo (ON RRP) facility that the Fed introduced in 2013, they are unwilling to lend at rates below the ON RRP rate. Second, since FHLBs face counterparty credit limits, the aggregate volume lent to a single counterparty is often limited (see here for details on these limits), which favors that a nontrivial arbitrage spread usually prevails.
The chart above shows that domestic depository institutions also lend in the fed funds market, but at very small volumes. This is due to their ability to earn the IORB rate, which disincentivizes them from lending reserves in the fed funds market when the clearing rate is below IORB.
Wrapping Up
The fed funds market has changed dramatically since 2008: The Fed expanded its balance sheet to support the U.S. economy, resulting in reserves in the banking system increasing substantially, and it also began paying interest on these reserve balances. Daily volume in the fed funds market has decreased substantially and market dynamics have evolved to capture arbitrage activity between FHLBs and branches of foreign banks.

Gara Afonso is the head of Banking Studies in the Federal Reserve Bank of New York’s Research and Statistics Group.

Gonzalo Cisternas is a financial research advisor in Non-Bank Financial Institution Studies in the Federal Reserve Bank of New York’s Research and Statistics Group.

Brian Gowen is a capital markets trading principal in the Federal Reserve Bank of New York’s Markets Group.

Jason Miu is a capital markets trading associate director in the Federal Reserve Bank of New York’s Markets Group.

Joshua Younger is a policy and market analysis advisor in the Federal Reserve Bank of New York’s Markets Group.
How to cite this post:
Gara Afonso, Gonzalo Cisternas, Brian Gowen, Jason Miu, and Joshua Younger, “Who’s Borrowing and Lending in the Fed Funds Market Today?,” Federal Reserve Bank of New York Liberty Street Economics, October 10, 2023, https://libertystreeteconomics.newyorkfed.org/2023/10/whos-borrowing-and-lending-in-the-fed-funds-market-today/
BibTeX: View |
Disclaimer
The views expressed in this post are those of the author(s) and do not necessarily reflect the position of the Federal Reserve Bank of New York or the Federal Reserve System. Any errors or omissions are the responsibility of the author(s).
 RSS Feed
 Follow Liberty Street Economics