











Economists often look at nominal wage growth to gauge labor market imbalances, price pressures, and households’ spending ability. But to use wage growth for these purposes, it is important to look through short-run fluctuations and retrieve underlying wage inflation. In this post, we use our own measure of wage growth persistence—called Trend Wage Inflation (TWIn in short)—to summarize what we learned from wage growth behavior in the past years and draw conclusions for what may lie ahead. Since peaking in late 2021, TWIn has been on a steady decline, reaching levels near those of the 2017-19 period. In the past few months, however, this decline seems to have lost momentum. Our analysis shows that most of the decline in TWIn between 2022 and 2025 was common across industries. Recently, however, a few sectors have shown a decoupling of wage growth dynamics.
Measuring Trend Wage Inflation
To recover the persistent (“trend”) component of wage inflation, we rely on a framework that combines worker-level data with time series filtering techniques. We have described the methodology in previous posts and in this paper. We estimate a model that decomposes wage growth in each industry into a persistent component and a noise term capturing transitory variation and measurement error. Each component is further split into a common and an industry-specific term. The chart below shows our estimated trend (TWIn, blue line), together with the realized twelve-month wage growth (red line). The shaded area around the trend is a 68 percent confidence band that captures the uncertainty associated with the estimates.
Trend Wage Inflation May Have Steadied After a Prolonged Period of Moderation
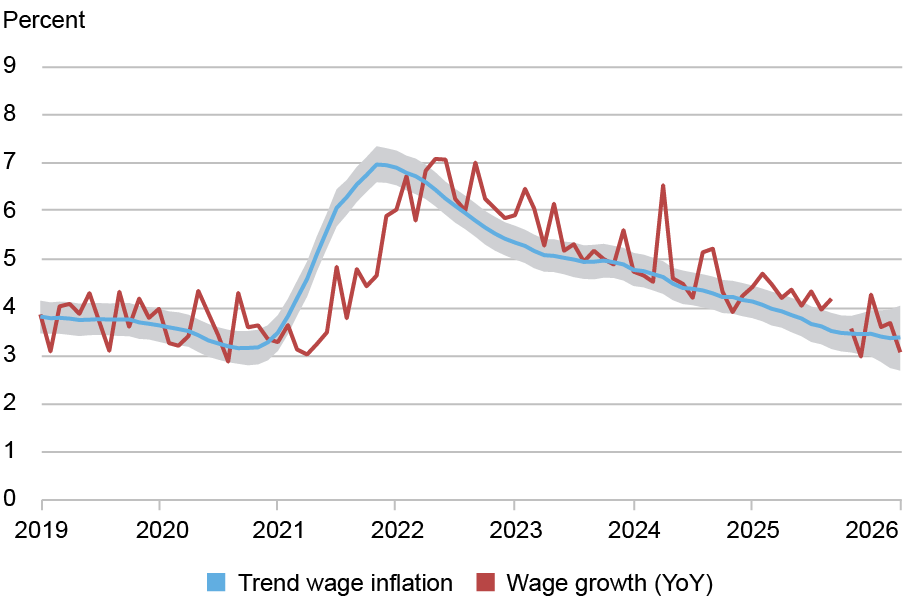
Note: The gap in the wage growth line reflects the absence of October 2025 wage data due to the U.S. government shutdown.
Since its peak toward the end of 2021, TWIn has been steadily declining, with the exception of the second half of 2023: that plateau, which we discussed in an earlier post, turned out to be transient. Looking closer at the recent months, TWIn appears to have leveled off again, this time near the 2017-19 average. This recent flattening is consistent with other signs of labor market stabilization. The unemployment rate has changed little since the end of last summer. And the HPW Labor Market Tightness Index, despite some ups and downs, has hovered near zero for several months, a value reflecting broadly balanced labor market conditions. This behavior therefore confirms our earlier analysis that TWIn moves in tandem with measures of labor market tightness.
Note that compared to the second half of the 2010s, the gap between TWIn and measures of trend price inflation, like the Multivariate Core Trend (MCT) inflation, is narrower, suggesting that households’ earnings have been growing more slowly in real terms.
Looking Under the Hood of Trend Wage Dynamics
Our methodology also allows us to investigate whether specific industries have disproportionately contributed to the dynamics of trend wage inflation. As a first step, in the chart below, we decompose the cumulative change in TWIn since its 2017-19 average into changes that are common across industries and changes that are industry-specific. The decline in TWIn since its peak was widespread across the economy. In other words, the common force that pushed up wage inflation in 2021 subsided thereafter.
Most of the TWIn Dynamics Have Been Common Across Industries
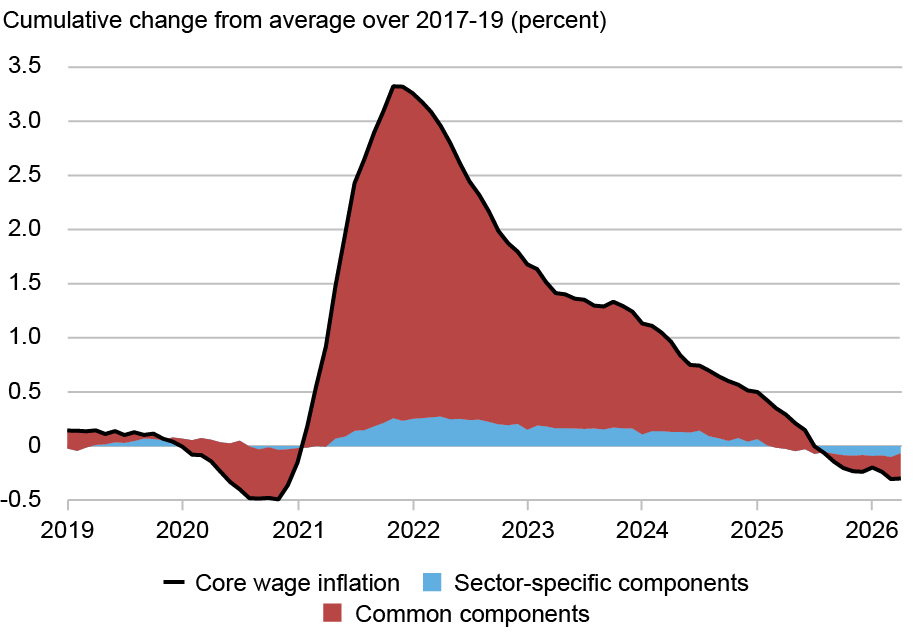
While quantitatively less sizable, sector-specific components of trend wage inflation have also retracted. As we discuss in the paper, these components typically tend to capture lower-frequency movements in trend wage inflation. In some instances, however, they can signal that trend wage dynamics in an industry are decoupling from the rest of the economy.
In this context, our analysis highlights two industries worth discussing. First, wage inflation of public administration workers has followed delayed dynamics with respect to the rest of the economy. This is not surprising: our analysis over a long time period shows that this industry always displays a strong idiosyncratic component.
Another industry in which wage inflation has remained higher than the rest of the economy is construction and mining. Our analysis suggests that these dynamics may be idiosyncratic to that industry, rather than a reflection of different sensitivities to a common factor. In the chart below, we show trend wage inflation in construction and mining (in red), in public administration (in gold), and in the aggregate (in blue).
Most but Not All Industries Have Seen a Synchronized Decline in Wage Growth
Trend wage inflation (percent)
The idiosyncratic trend specific to the construction and mining industry has risen since 2022, in contrast with economy-wide downward pressures to wage growth. As a result, wage growth in this industry has been consistently and persistently stronger than in the rest of the economy. This pattern could be related to construction of AI data centers, with sustained labor demand fueling wage inflation. Recent reductions in net immigration could work in the same direction, especially since the construction industry tends to rely on immigrant workers.
In summary, our measure of persistent nominal wage growth, TWIn, provides an indication of underlying wage inflation. After a prolonged period of moderation, the easing in our TWIn measure appears to have slowed. This stabilization, at levels near those seen in the second half of the 2010s, is consistent with a broadly balanced labor market. Looking ahead, considerable uncertainty remains. On the one hand, specific industries such as construction may continue to put some upward pressure on wage inflation, as they have done in recent months. On the other hand, any deterioration of labor market conditions could result in renewed downward pressure on wage inflation.

Martín Almuzara is a research economist in the Federal Reserve Bank of New York’s Research and Statistics Group.

Richard Audoly is a research economist in the Federal Reserve Bank of New York’s Research and Statistics Group.

Davide Melcangi is an economic research advisor in the Federal Reserve Bank of New York’s Research and Statistics Group.
How to cite this post:
Martin Almuzara, Richard Audoly, and Davide Melcangi, “Assessing the Current State of Wage Inflation,” Federal Reserve Bank of New York Liberty Street Economics, May 26, 2026, https://doi.org/10.59576/lse.20260526
BibTeX: View |



Disclaimer
The views expressed in this post are those of the author(s) and do not necessarily reflect the position of the Federal Reserve Bank of New York or the Federal Reserve System. Any errors or omissions are the responsibility of the author(s).

 RSS Feed
 Follow Liberty Street Economics

If it is wage growth, why do you choose to brand it as TWIn?
Is it not in a state of deflation!