


During 2026:Q1, household debt balances increased slightly, by $18 billion, to reach $18.8 trillion, according to the latest Quarterly Report on Household Debt and Credit from the New York Fed’s Center for Microeconomic Data. Amid upticks in mortgage, HELOC, and auto balances and a seasonal decline in credit card balances, student loan balances remained unchanged. However, the share of student loan balances past due increased, nearing pre-pandemic levels at just over 10 percent. In this post, we focus on which borrowers entered default on their federal student loans over the past two quarters. We find that the average borrower entering default is nearly 40 years old, was not past due on their student loans prior to the pandemic, and is more likely to live in the South. While defaulted borrowers are more likely to be past due on other forms of debt, the overall scope of student loan defaults is still relatively low, suggesting that fears of broader contagion to other credit products are premature.
| Methodology Note: This quarter’s report also introduces a change in the credit score measure we use in several of our charts. Starting with this report, the figures and analysis that depend on credit scores will shift to using VantageScore 4.0, instead of Equifax Risk Score 3.0. We provide some context on how this shift will impact the observed population with credit scores and our analysis in this technical paper. |
The (Gradual) Return to Repayment
At the onset of the pandemic, student loan payments were paused, and interest rates were set to zero percent. Due to many extensions of the payment pause, borrowers were not required to make payments for over three years. The pause officially ended in September 2023, when payments resumed and interest began accruing again. Most borrowers were expected to make their first payment in October 2023. While payments were required, during a 12-month “on-ramp” period through October 2024, missed payments were not reported to credit bureaus.
As we noted in our previous post, the first student loan delinquencies were reported on credit reports during 2025:Q1. Since then, over 17 percent of student loan borrowers have fallen at least 90 days past due on their payments at least once. As it takes 270 days of missed payments to enter federal student loan default, 2025:Q4 was the first quarter when new defaults began appearing on credit reports. We estimate that roughly 1 million federal student loan borrowers defaulted during 2025:Q4, with an additional 2.6 million borrowers defaulting during 2026:Q1. Note that borrowers in the now-defunct SAVE repayment plan entered repayment, but were put into a forbearance during the on-ramp due to litigation. Very few have re-entered repayment since missed payments were reported to credit bureaus. This delay means that a second wave of defaults might emerge as these 7 million borrowers reach the nine-month mark in the repayment period.
Who Is Entering Default?
We begin our exploration by examining the age distribution of newly defaulted student loan borrowers. In the chart below, we plot the age distribution of student loan borrowers who entered default between 2018:Q2 and 2019:Q4 (the dashed gold line) against those who newly defaulted over the last two quarters (the solid red line). Additionally, we plot the means of both groups with vertical lines.
Borrowers who recently defaulted are 2.5 years older on average than those in default prior to the pandemic (38.9 years compared to 36.4 years). Of course, this increase in average age could be an artifact of the four-year pause on delinquency reporting rather than a genuine shift in the profile of a borrower in default—someone who might have otherwise defaulted in 2021 would instead default in 2025, now four years older. However, comparing the full distribution of pre-pause and post-pause defaulters suggests that there is also a shift across the age demographic of borrowers at risk of default. The chart shows that the curve has not merely shifted four years older. Instead, there is uniformly more mass among older borrowers, especially those 50 and older. The flattening in the 25-30 age range and the increased mass in the 50+ age range is further evidence that older student loan borrowers are struggling with payments at a higher rate than before the pause on payments.
The Age Distribution of Defaulted Borrowers Has Shifted
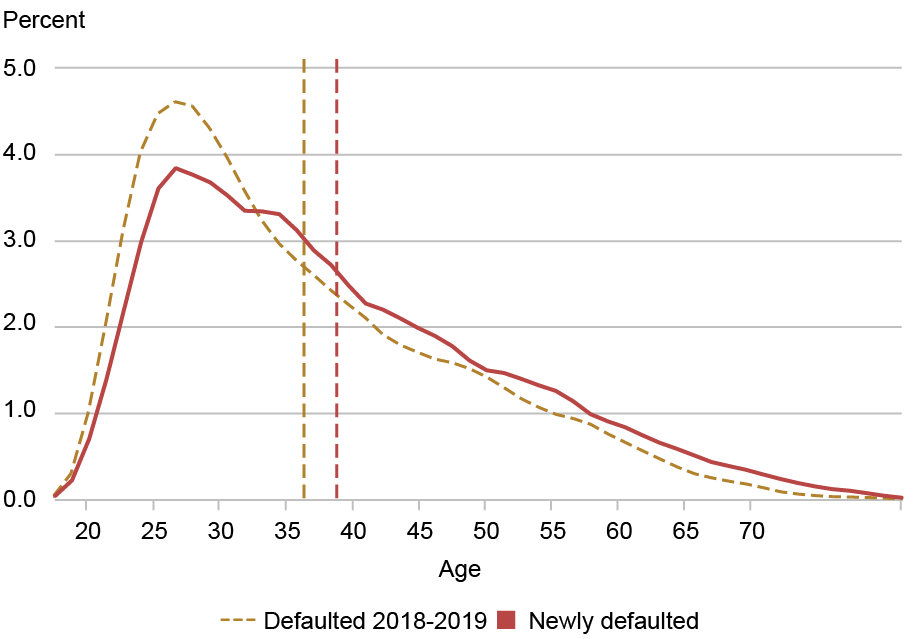
Notes: The chart plots the age distribution of borrowers who defaulted in 2025:Q4 or 2026:Q1 (bolded red line) and borrowers who defaulted between 2018:Q2 and 2019:Q4 (dotted gold line). The corresponding vertical lines show the means for each group.
Were These Borrowers Already Struggling with Payments?
To see whether newly defaulted borrowers had struggled with payments before the pandemic, we look back at the 2019 payment status of those borrowers who recently defaulted. The chart below shows that most recent defaulters were not past due before the pause. Nearly 30 percent were current on their loans and making payments, while nearly half either had not yet taken out student loans or had no payment due yet (due to grace periods, deferment, or $0 payments under income-driven repayment plans). About 20 percent were past due but not yet in default, and about 4 percent were already in default before the pause. So roughly one in four recently defaulted borrowers were already past due before the pandemic but were given a reprieve during the payment pause, then ultimately fell into default after payments resumed.
Among those who did have payments due in 2019, the majority were current on their loans at that time. Overall, these patterns suggest that the borrowers who defaulted over the past two quarters were not concentrated among those who were struggling with payments before the pandemic—more than three-quarters were current or did not have a student loan payment due in 2019.
Most of the Newly Defaulted Were Not Past Due on Their Student Loans before the Pause
Percent
Notes: The chart shows the 2019 payment status for borrowers who newly entered default during 2025:Q4 or 2026:Q1.
The map below shows the share of student loan borrowers in each state who have newly defaulted on their student loans. States in the South have the largest share of newly defaulted borrowers, with at least 10 percent of borrowers defaulting in Louisiana, Mississippi, Alabama, Georgia, and South Carolina. However, no state was immune from the wave of defaults. Even the states with the lowest concentration have a non-trivial share, at least 4 percent, of student loan borrowers in default.
New Student Loan Defaults Are Concentrated in the South
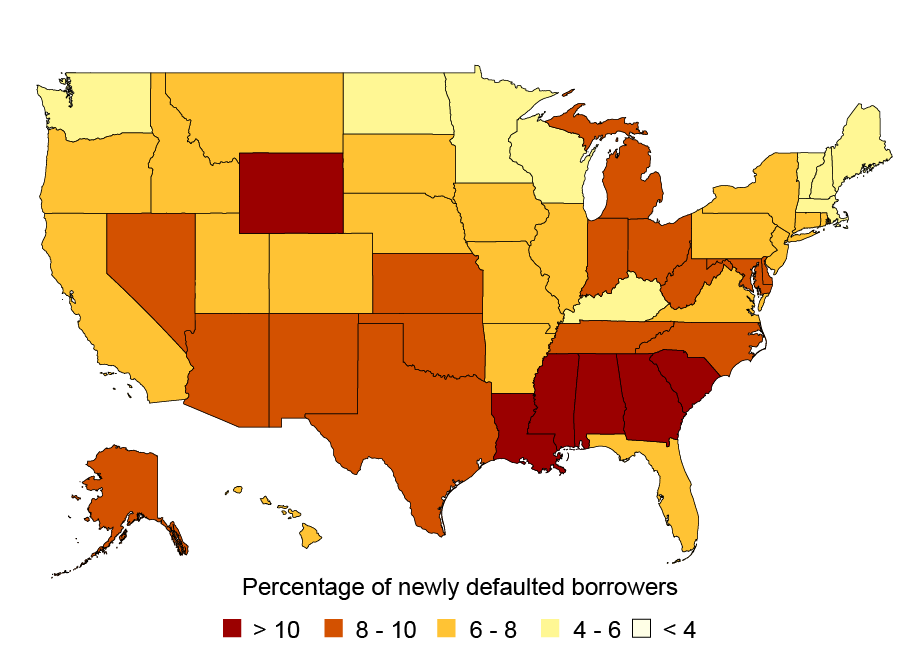
Notes: This map presents the share of student loan borrowers in each state who defaulted on their federal student loans in 2025:Q4 or 2026:Q1.
Implications for Defaulted Borrowers and Other Credit Products
What now for these 3.6 million defaulted borrowers? The primary consequence of default is garnishment of wages, Social Security, and tax returns. However, collection efforts for defaulted federal student loan borrowers are currently suspended with no clear timeline for resumption. Another consequence is deteriorated credit access. On average, credit scores for defaulted borrowers dropped 91 points between 2024:Q3 and 2025:Q4 (from 567 to 476; credit scores are Equifax Risk Score 3.0). While many of these borrowers already had subprime credit scores before missed student loan payments further reduced their scores, most will be cut off from accessing traditional credit while the default remains on their credit record, which typically lasts for seven years.
But what about their existing credit? The chart below shows delinquency rates for post-pandemic defaulted borrowers on other credit products in 2019:Q4, in 2020:Q3, and in 2026:Q1. These borrowers saw modest declines in delinquency rates during the pandemic, consistent with the trend across the broader population. But they now have very high delinquency rates across all credit products: nearly 40 percent of those with auto loans are past due, 56 percent of those with at least one credit card are past due, and 20 percent with a mortgage are past due. These high rates suggest that their payment struggles extend beyond student loans—and are likely to worsen when collection efforts resume.
Newly Defaulted Student Loan Borrowers Also Tend to Be Behind on Other Debts
Delinquency rate (percent)
Notes: This chart presents the share of newly defaulted borrowers that are delinquent on auto loans (blue), credit cards (gold), and mortgages (gray) in 2019:Q4, 2020:Q3, and 2026:Q1. Each share is computed conditional on borrowers holding that debt type.
What does this mean for the broader household credit space? Delinquent and newly defaulted borrowers make up only 2 percent of the credit population and, given their troubled credit records, generally do not have extensive debt portfolios; spillover from the recent wave of defaults and delinquencies to broader credit markets is likely to be limited. Balances held by defaulted or delinquent student loan borrowers represent 2.7 percent of auto loans, 2 percent of credit cards, and 1 percent of mortgages. Further, Chart 14 in the Quarterly Report on Household Debt & Credit shows a decline in new flows into student loan delinquency, suggesting that the initial wave has crested.
Though delinquencies may increase again when borrowers on the sunsetting SAVE plan transition back into repayment this year, we believe that the largest wave of student loan defaults has passed. But the ripples from this wave may continue to reverberate through the credit space if the financial struggles from defaulted loans spill over into family members’ credit profiles, and when collections on defaulted loans eventually resume. We will continue to monitor student loan delinquencies and potential spillovers in the coming quarters.

Zara Jacob is a research analyst in the Federal Reserve Bank of New York’s Research and Statistics Group.

Donghoon Lee is an economic research advisor in the Federal Reserve Bank of New York’s Research and Statistics Group.

Daniel Mangrum is a research economist in the Federal Reserve Bank of New York’s Research and Statistics Group.

Joelle Scally is an economic policy advisor in the Federal Reserve Bank of New York’s Research and Statistics Group.

Wilbert van der Klaauw is an economic research advisor in the Federal Reserve Bank of New York’s Research and Statistics Group.
How to cite this post:
Zara Jacob, Donghoon Lee, Daniel Mangrum, Joelle W. Scally, and Wilbert van der Klaauw, “Federal Student Loan Defaults Return After Pandemic Pause,” Federal Reserve Bank of New York Liberty Street Economics, May 12, 2026, https://doi.org/10.59576/lse.20260512
BibTeX: View |


Disclaimer
The views expressed in this post are those of the author(s) and do not necessarily reflect the position of the Federal Reserve Bank of New York or the Federal Reserve System. Any errors or omissions are the responsibility of the author(s).
 RSS Feed
 Follow Liberty Street Economics