


This post presents an update of the economic forecasts generated by the Federal Reserve Bank of New York’s dynamic stochastic general equilibrium (DSGE) model. We describe very briefly our forecast and its change since March 2026. To summarize, inflation forecasts are higher in 2026 than predicted in March. Projections for the short-run real natural rate of interest (r*) increased slightly relative to March.
Note: The DSGE model forecast is not an official New York Fed forecast, but only an input to the Research staff’s overall forecasting process. For more information about the model and variables discussed here, see our DSGE model Q & A.
The New York Fed DSGE model forecasts use data released through 2026:Q1, augmented for 2026:Q2 with median forecasts for real GDP growth and core PCE inflation from the May release of the Philadelphia Fed Survey of Professional Forecasters (SPF), as well as the yields on 10-year Treasury securities and Baa corporate bonds based on 2026:Q2 averages up to May 27. Starting in 2021:Q4, the expected federal funds rate (FFR) between one and six quarters into the future is restricted to equal the corresponding median point forecast from the latest available Survey of Market Expectations (SME) in the corresponding quarter. For the current projection, this is the April SME.
The SPF expects core inflation in 2026:Q2 to be more than 1 percent higher in annualized terms than the DSGE model expected in March. In light of this forecast miss (if the SPF turns out to be correct), the model revised its inflation forecasts upward in 2026, from 2.4 to 3.1 percent. The DSGE attributes the forecast error to mark-up shocks, which may capture the effects of both tariff and energy shocks. The model views the impact of these shocks as vanishing by the end of the year and hence the inflation forecasts are largely unchanged throughout the rest of the forecast horizon.
On the output front, the DSGE is more upbeat than it was in March, although its projections remain somewhat pessimistic. The model does see the positive growth effect of the AI-related boom in investment—positive MEI (marginal efficiency of investment) shocks push output up, especially in 2026—but also believes that the adverse markup shocks will push down growth in the future.
The model’s predictions for the short-run real natural rate of interest (r*) increased by 0.1 percentage point relative to March (2.0, 1.7, and 1.3 percent for 2026, 2027, and 2028, versus 1.9, 1.6, and 1.3 percent), partly reflecting higher total factor productivity (TFP).
Forecast Comparison
| Forecast Period | 2026 | 2027 | 2028 | 2029 | ||||
|---|---|---|---|---|---|---|---|---|
| Date of Forecast | Jun 26 | Mar 26 | Jun 26 | Mar 26 | Jun 26 | Mar 26 | Jun 26 | Mar 26 |
| GDP growth (Q4/Q4) | 1.2 (-2.2, 4.5) | 1.0 (-3.4, 5.6) | 0.2 (-5.0, 5.2) | 0.2 (-5.1, 5.4) | 0.7 (-4.8, 6.0) | 0.8 (-4.7, 6.3) | 1.5 (-4.1, 6.9) | 1.3 (-4.4, 6.9) |
| Core PCE inflation (Q4/Q4) | 3.1 (2.5, 3.7) | 2.5 (1.6, 3.3) | 1.8 (0.7, 3.0) | 2.0 (0.8, 3.2) | 1.6 (0.4, 2.9) | 1.9 (0.6, 3.2) | 1.7 (0.4, 3.0) | 2.0 (0.6, 3.3) |
| Real natural rate of interest (Q4) | 2.0 (0.7, 3.3) | 1.9 (0.6, 3.3) | 1.7 (0.2, 3.1) | 1.6 (0.0, 3.1) | 1.3 (-0.3, 2.9) | 1.2 (-0.4, 2.8) | 1.1 (-0.5, 2.8) | 1.0 (-0.6, 2.7) |
Notes: This table lists the forecasts of output growth, core PCE inflation, and the real natural rate of interest from the June 2026 and March 2026 forecasts. The numbers outside parentheses are the mean forecasts, and the numbers in parentheses are the 68 percent bands.
Forecasts of Output Growth
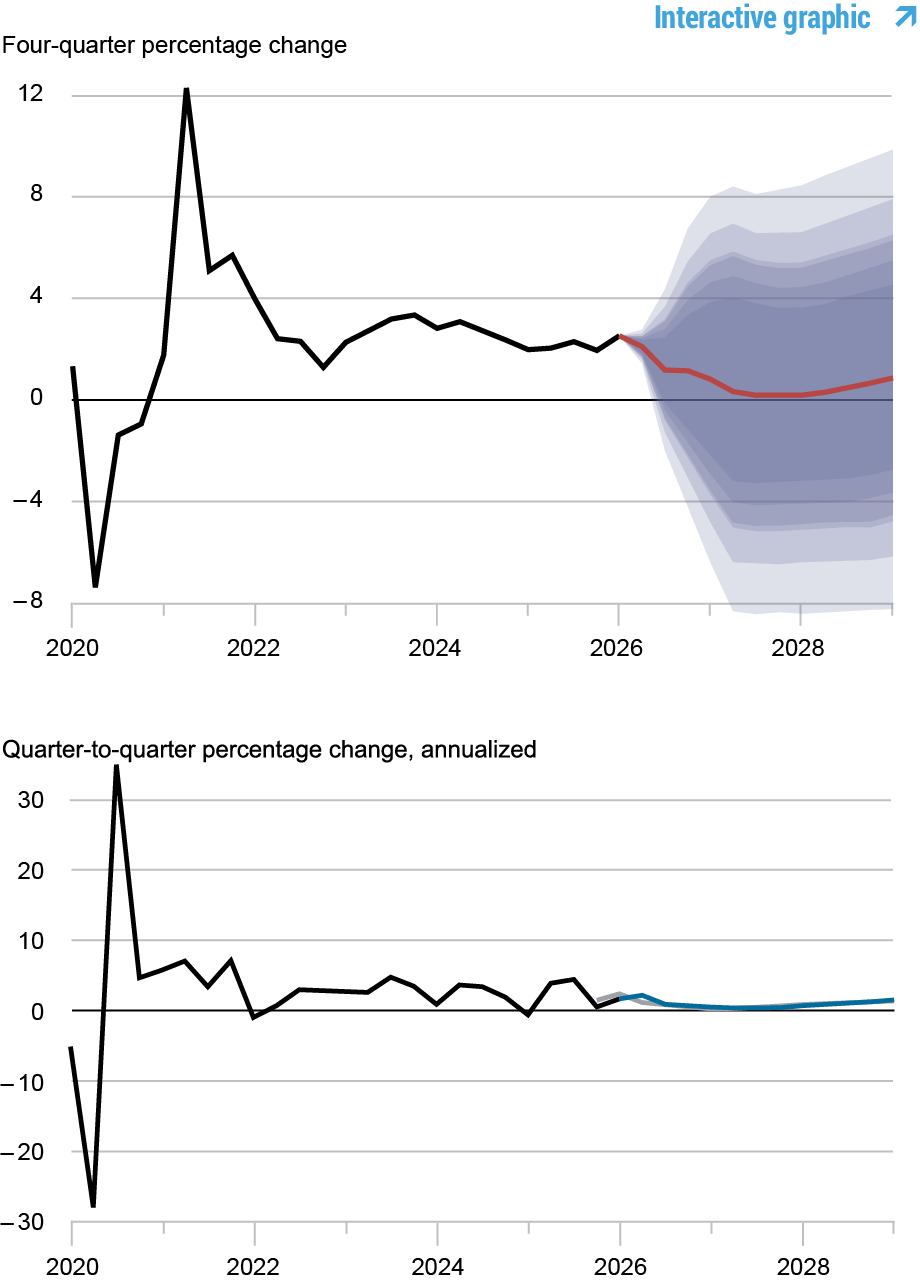
Notes: These two panels depict output growth. In the top panel, the black line indicates actual data and the red line shows the model forecasts. The shaded areas mark the uncertainty associated with our forecasts at 50, 60, 70, 80, and 90 percent probability intervals. In the bottom panel, the blue line shows the current forecast (quarter-to-quarter, annualized), and the gray line shows the March 2026 forecast.
Forecasts of Inflation
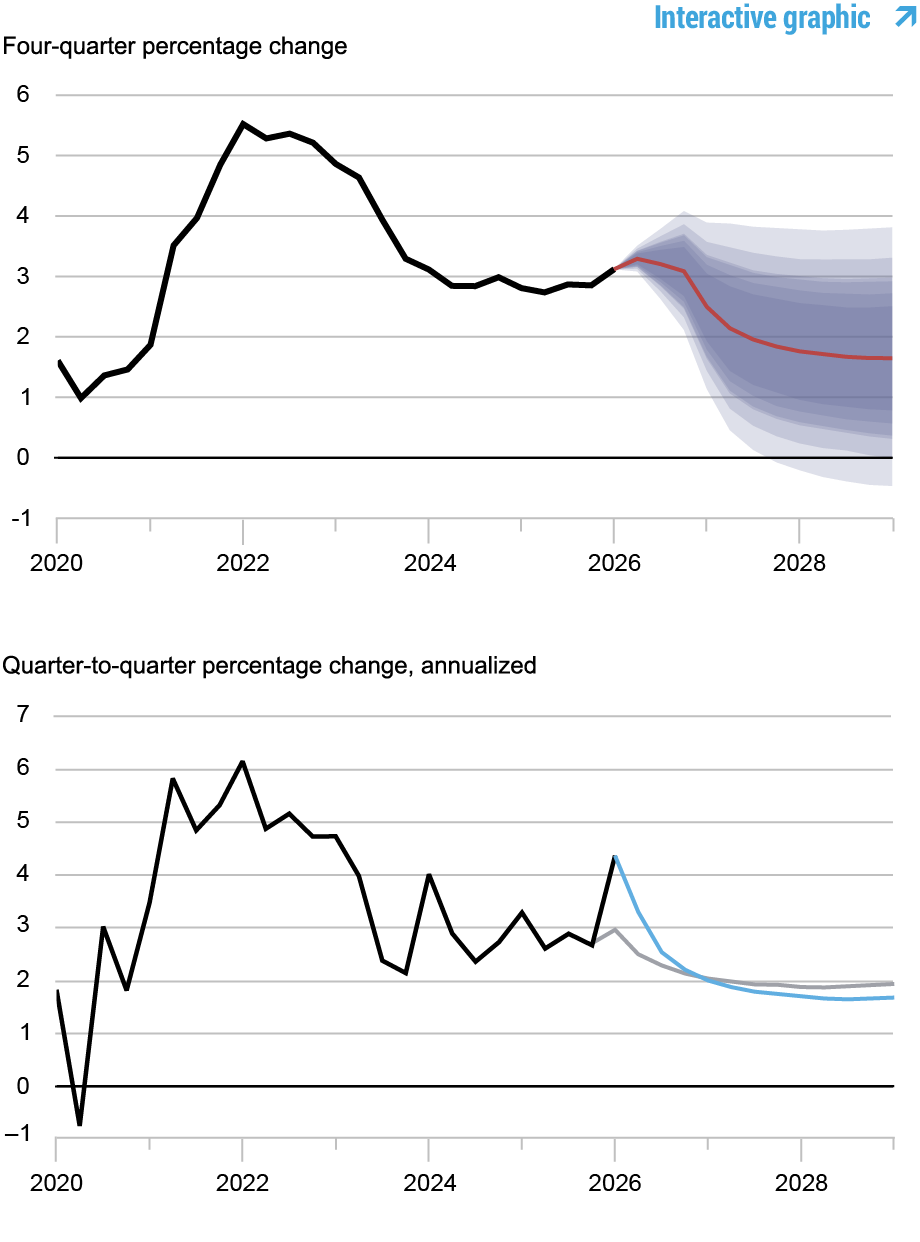
Notes: These two panels depict core personal consumption expenditures (PCE) inflation. In the top panel, the black line indicates actual data and the red line shows the model forecasts. The shaded areas mark the uncertainty associated with our forecasts at 50, 60, 70, 80, and 90 percent probability intervals. In the bottom panel, the blue line shows the current forecast (quarter-to-quarter, annualized), and the gray line shows the March 2026 forecast.
Real Natural Rate of Interest
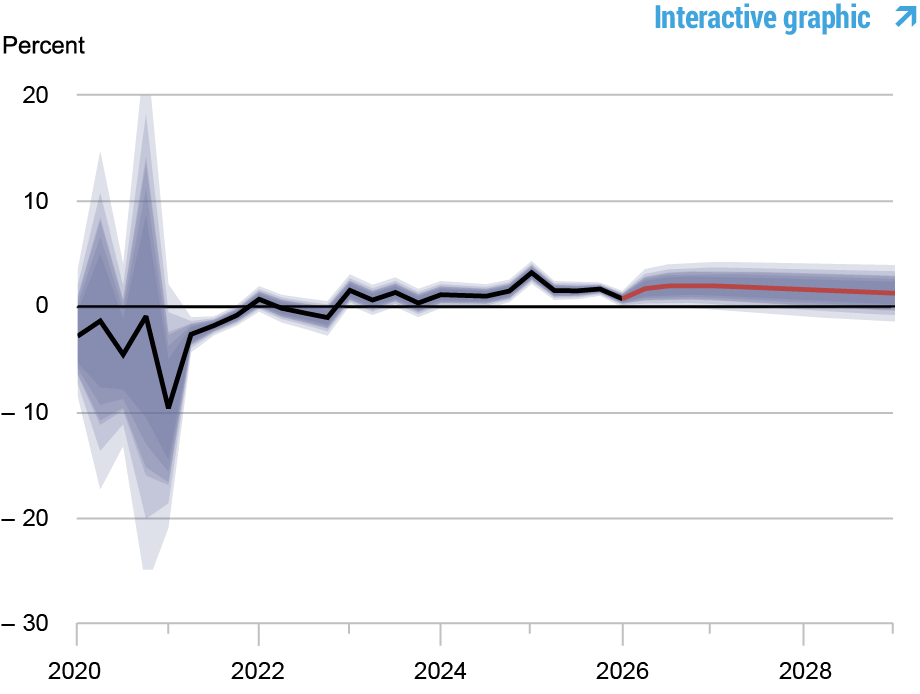
Notes: The black line shows the model’s mean estimate of the real natural rate of interest; the red line shows the model forecast of the real natural rate. The shaded area marks the uncertainty associated with the forecasts at 50, 60, 70, 80, and 90 percent probability intervals.

Marco Del Negro is an economic research advisor in the Federal Reserve Bank of New York’s Research and Statistics Group.

Keshav Dogra is an economic research advisor in the Federal Reserve Bank of New York’s Research and Statistics Group.

Elena Elbarmi is a research analyst in the Federal Reserve Bank of New York’s Research and Statistics Group.

Donggyu Lee is a research economist in the Federal Reserve Bank of New York’s Research and Statistics Group.

Michael Pham is a research analyst in the Federal Reserve Bank of New York’s Research and Statistics Group.
How to cite this post:
Marco Del Negro, Keshav Dogra, Elena Elbarmi, Donggyu Lee, and Michael Pham, “The New York Fed DSGE Model Forecast—June 2026,” Federal Reserve Bank of New York Liberty Street Economics, June 22, 2026, https://libertystreeteconomics.newyorkfed.org/2026/06/the-new-york-fed-dsge-model-forecast-june-2026/
BibTeX: View |


Disclaimer
The views expressed in this post are those of the author(s) and do not necessarily reflect the position of the Federal Reserve Bank of New York or the Federal Reserve System. Any errors or omissions are the responsibility of the author(s).
 RSS Feed
 Follow Liberty Street Economics