


Several states have recently capped consumer loan rates with the stated purpose of protecting borrowers. In a recent Staff Report, we study how these interventions have played out in three states. In our first post about that study, we showed that rate caps lead riskier borrowers to face rationing in the credit market. One question that naturally arises is what lenders do with the credit they used to provide to high-risk borrowers before the caps were imposed. Lenders that lend exclusively to high-risk borrowers (at rates above the cap) may decide to stop lending to high-risk borrowers in that state. Others, however, may try to change their “credit box” by lending more to somewhat safer borrowers. In this post, we will try to understand how lenders reallocate credit after usury limits are implemented.
Rationing versus Re-allocation
While credit rationing under usury limits is clearly predicted by textbook economic theory, reallocation is less obvious. After all, if lending more to safer borrowers is profitable with a rate cap, why not do so without a cap? Based on the simple model provided in the last post, rate caps on high-risk borrowers should not affect borrowers with higher risk scores that have access to traditional credit markets. However, lenders may not be able to lend to both high-risk and low-risk borrowers due to limited access to capital, and some will find it more profitable to concentrate on high-risk borrowers. When the usury limits are put in place, lenders who had previously chosen to focus on high-risk borrowers may reallocate their capital to safer borrowers.
Some existing theoretical work supports this view. For instance, an early analysis by Blitz and Lang (1965) shows that under certain conditions, lenders will reallocate credit to moderate-risk borrowers when facing a usury limit: “it is the less risky borrowers…who are most likely to benefit from usury limits.” Indeed, Adam Smith, of all people, favored usury limits so more credit would flow from “prodigals and projectors” toward more “sober” borrowers.
There is empirical evidence of credit reallocation as well. Hodenborn finds usury limits in the 19th century led banks to favor safer borrowers “to the detriment of small, subprime borrowers.” A study of usury limits in Peru found that banks made fewer small loans and more medium-sized ones, “favoring incumbent firms at the expense of new borrowers.” Our paper looks for evidence of credit reallocation in the context of a modern usury limit in the U.S.
Our Study
We examined how credit changed in three states that enacted 36 percent rate caps sometime between 2016 and 2022 (Illinois, South Dakota, and North Dakota). Our credit data are from the New York Fed Consumer Credit Panel/Equifax (CCP). The CCP tracks quarterly credit profiles for an anonymized random sample of 5 percent of households covered by the Equifax credit bureau. The sample comprises over 35 million borrowers. We measure borrower creditworthiness with the Equifax Risk Score 3.0; scores range between 350 and 800 and increase with creditworthiness.
The chart below displays the distribution of risk scores for the three states that enacted a usury limit between 2016 and 2022. Specifically, the chart shows the breakdown of borrowers within each risk score decile, showing the detailed distribution of risk scores within each decile. The risk score deciles are defined based on risk scores in the year before the usury limit passed (see our Staff Report for details). The median risk score in the lowest decile is about 518.
Risk Scores in the Lowest Decile Are About 150 Points Below Prime on Average
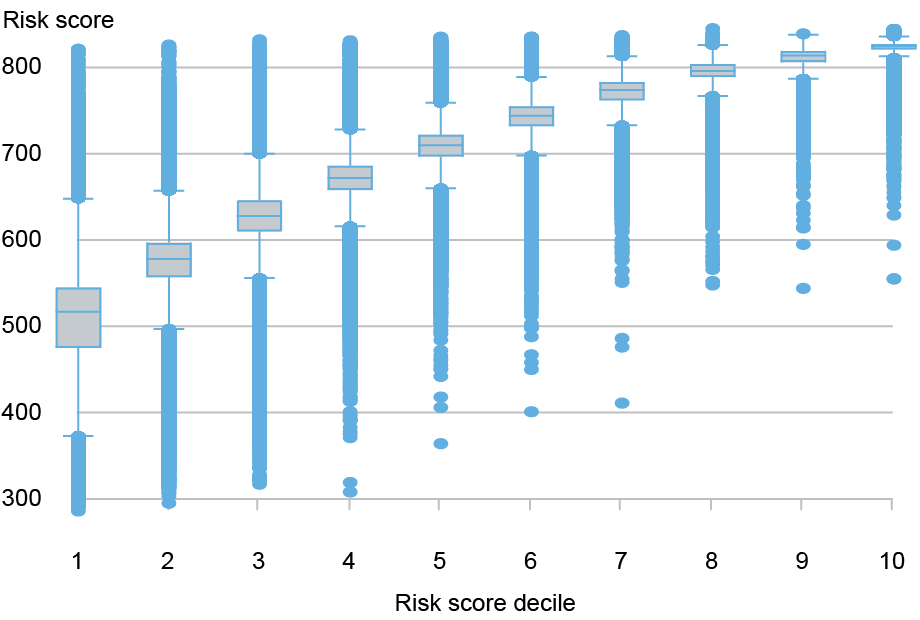
Notes: This chart shows the distribution of risk scores by risk score decile for households in Illinois, North Dakota, and South Dakota; households with the lowest scores are in the first decile. Risk scores are as of the year before usury limits took effect. The center line in each box represents the median score in that decile. The top and bottom of each box represent the 25th and 75th percentiles of risk scores, respectively, in that decile. The interquartile range is the difference between the 75th and 25th quartiles.
In the absence of interest rate caps, high-cost lenders specialize in extending credit to higher-risk (low risk score) borrowers that are generally avoided by traditional, more risk-averse lenders such as banks and credit unions. In the presence of usury limits, these lenders may instead choose to lend more to slightly more creditworthy borrowers, for whom the usury limit does not bind. For instance, the median risk score in the third decile is around 620, which is the traditional cutoff for whether a borrower is subprime or prime. Lenders may extend newly available credit to prime borrowers after usury limits make lending to subprime borrowers unprofitable.
The chart below shows the increase in borrowing over time for the third risk score decile relative to all higher deciles. Similar increases in borrowing are observed in the fourth and fifth risk score deciles relative to all higher deciles. The results from these graphical analyses are consistent with lenders reallocating credit to relatively more creditworthy borrowers after the imposition of usury limits. Further consistent with this view, in the Staff Report we show that while borrowing declines substantially for borrowers in the lowest risk score decile, only a marginal decline is observed in the aggregate. This indicates that the increase in lending to borrowers in the third through fifth risk score deciles mostly offsets the decline in lending to borrowers in the second risk score decile.
Borrowers in the Middle of the Risk Score Distribution See Increased Lending after Rate Caps Relative to Control States
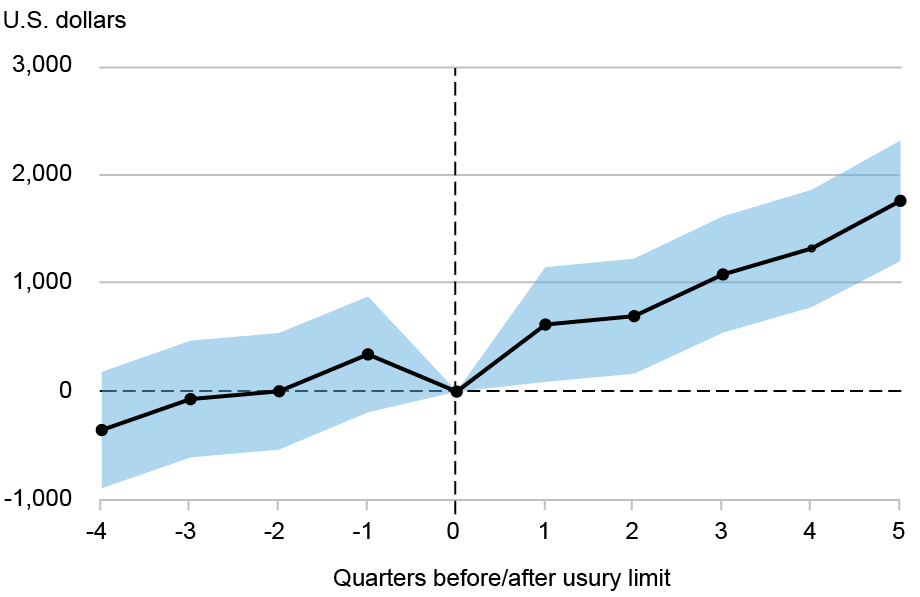
Note: This chart shows how debt balances changed for borrowers in the third risk decile in Illinois, North Dakota, and South Dakota relative to their counterparts in control states.
Conclusion
In the previous post, we found that lenders reduce credit to the least creditworthy borrowers after usury limits are imposed. In this post, we show evidence that lenders simultaneously increase credit to marginally more creditworthy borrowers. Whether this reallocation was an intention of the proposer of the limits is unclear. In any case, our results imply that there may be tradeoffs involved in enacting usury limits, with some borrowers facing more adverse outcomes as others benefit.

Rajashri Chakrabarti is an economic research advisor in the Federal Reserve Bank of New York’s Research and Statistics Group.

Gabriel Leonard is a research analyst in the Federal Reserve Bank of New York’s Research and Statistics Group.

At the time this post was written, Donald P, Morgan was a financial research advisor in the Federal Reserve Bank of New York’s Research and Statistics Group. He is now retired.

Thu Pham is a research analyst in the Federal Reserve Bank of New York’s Research and Statistics Group.

Lee Seltzer is a financial research economist in the Federal Reserve Bank of New York’s Research and Statistics Group.
How to cite this post:
Rajashri Chakrabarti, Gabriel Leonard, Donald P. Morgan, Thu Pham, and Lee Seltzer, “The Unintended Effects of Interest Rate Caps: Credit Reallocation to Safer Borrowers,” Federal Reserve Bank of New York Liberty Street Economics, June 3, 2026, https://doi.org/10.59576/lse.20260603b
BibTeX: View |


Disclaimer
The views expressed in this post are those of the author(s) and do not necessarily reflect the position of the Federal Reserve Bank of New York or the Federal Reserve System. Any errors or omissions are the responsibility of the author(s).
 RSS Feed
 Follow Liberty Street Economics